The Compass of Reality
Turning Data into Strategic Understanding Before Impression Takes Over
How can a decision maker distinguish the reality they need to understand from the picture their measurement tools permit them to see?
A journey from question and definition through causality and dashboards to a decision that states its evidence, limits, and review conditions.
An invitation to readA thought you can test
Illustrative model · invented inputs, not evidence or a prediction.
Put 75% on trial
Examine the claim through five questions. The numbers are invented for this explanation.
1Denominator
What is the denominator, and why is it the population relevant to this decision?
2Definition
What counts as agreement? A change in wording can change what is measured.
3Time
When was the observation made? A snapshot does not establish a trend.
4Comparison
Were the groups and collection methods comparable?
5Causality
What would have happened without the intervention? A before-and-after difference alone does not identify its effect.
An arithmetically correct ratio can support a much narrower claim than its headline suggests.
- Denominator — What is the denominator, and why is it the population relevant to this decision?
- Definition — What counts as agreement? A change in wording can change what is measured.
- Time — When was the observation made? A snapshot does not establish a trend.
- Comparison — Were the groups and collection methods comparable?
- Causality — What would have happened without the intervention? A before-and-after difference alone does not identify its effect.
An invitation to read
A number can be correct, the analysis mathematically sound, and the chart clear—yet the resulting decision can still be wrong. The book begins with this paradox because a number is not the event itself. It measures one part through an instrument, definition, period, and human choices. An official source does not release a leader from asking what was measured, for what purpose, and who remained outside the picture.
The inquiry moves from defining the question to denominators, distributions, time windows, and revisions that change official data after it has entered reports. It then examines confidence and causality: fewer complaints after a program do not prove the program caused the decline. Responsible attribution needs a plausible counterfactual and calibration between the strength of knowledge and the confidence expressed.
The journey reaches dashboards, rankings, and incentives, then turns to decision under incomplete knowledge. It does not ask leaders to await certainty; it weighs the value of information, cost of error and delay, and reversibility. Practical tools document the question, comparison, attribution, definition, and judgment, while the title remains provisional and the wider manuscript remains under review.
Anatomy of the argument
An analytical reading of the supplied brief. These stages are not manuscript chapter titles.
- 01
Before opening the data file
Define the decision, question, concept, and source, then identify who owns and changes the indicator boundary.
- 02
Interrogate the number
Inspect denominator, distribution, period, comparability, and revisions, including narrative debt when evidence changes but the story does not.
- 03
Confidence, causality, and attribution
Calibrate certainty, build a counterfactual, and distinguish observed improvement from an effect attributable to an intervention.
- 04
What the dashboard chooses to show
Audit targets, weights, missing groups, and incentives that make a metric less representative of its purpose.
- 05
Judgment under incomplete knowledge
Balance information value, reversibility, error, and delay, and write review conditions before the result is known.
Concept laboratory
The number passport
A record of definition, source, denominator, period, version, and comparison limits before a number enters a decision.
Narrative debt
The accumulated cost of keeping an old number or explanation in reports after newer evidence has overtaken it.
The attribution court
A source-stated framework separating measured improvement from the share a team or program can reasonably claim.
The decision balance
An illustrative model weighing error, delay, reversibility, and the value of more information before choosing how much to investigate.
Illustrative model · invented inputs, not evidence or a prediction.Visual library
Original conceptual studies. Covers are proposals; captions are editorial writing, not manuscript quotations.
The Compass of Reality
How can a decision maker distinguish the reality they need to understand from the picture their measurement tools permit them to see?
Download SVG study ↓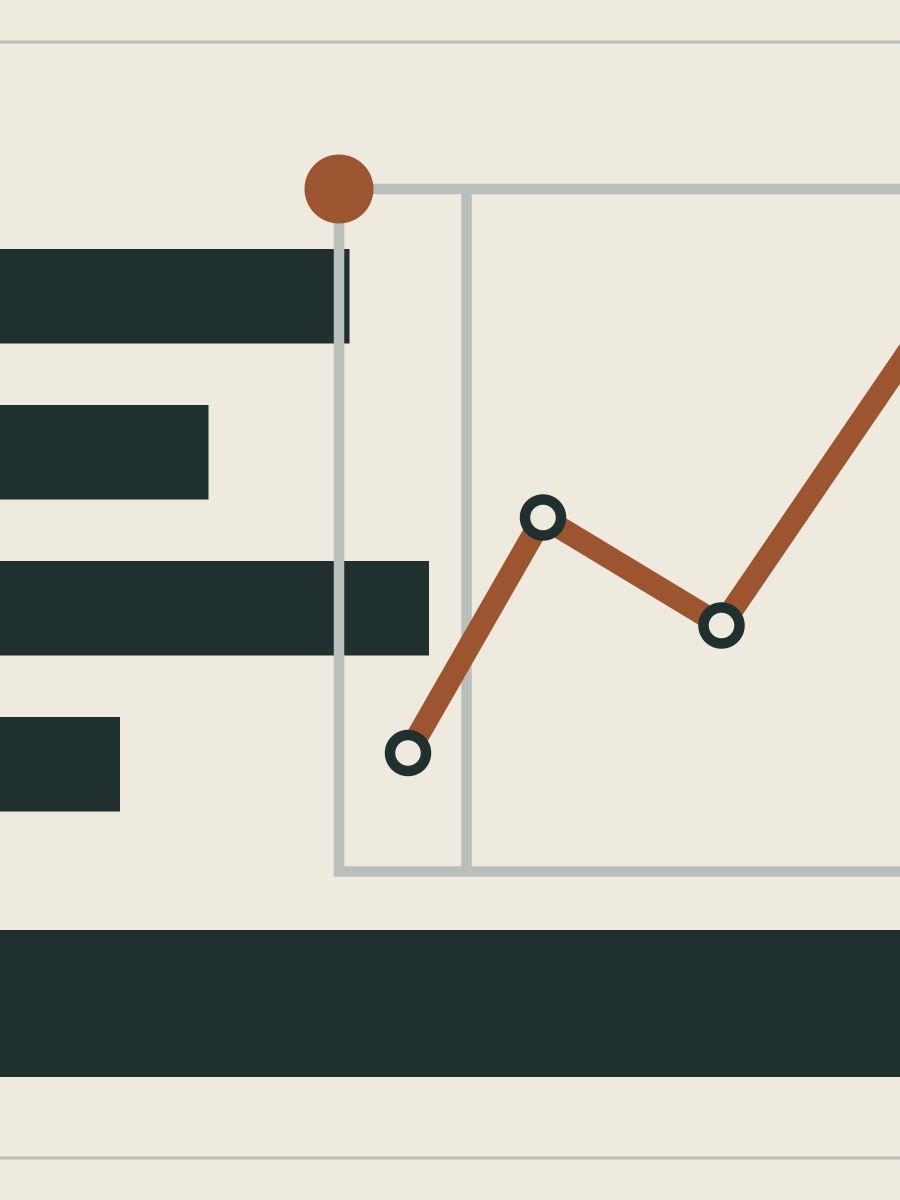
A journey from question and definition through causality and dashboards to a decision that states its evidence, limits, and review conditions.
Download SVG study · 2:1 ↓

Begin with the denominator
A ratio cannot be understood before the population beneath it is known. The question is not only arithmetic: why is this denominator the population relevant to the decision?
Download SVG study ↓
A definition draws the number’s boundary
The definition decides what enters an indicator and what remains outside it. A stable name does not guarantee a stable meaning when the rules producing the value change.
Download SVG study ↓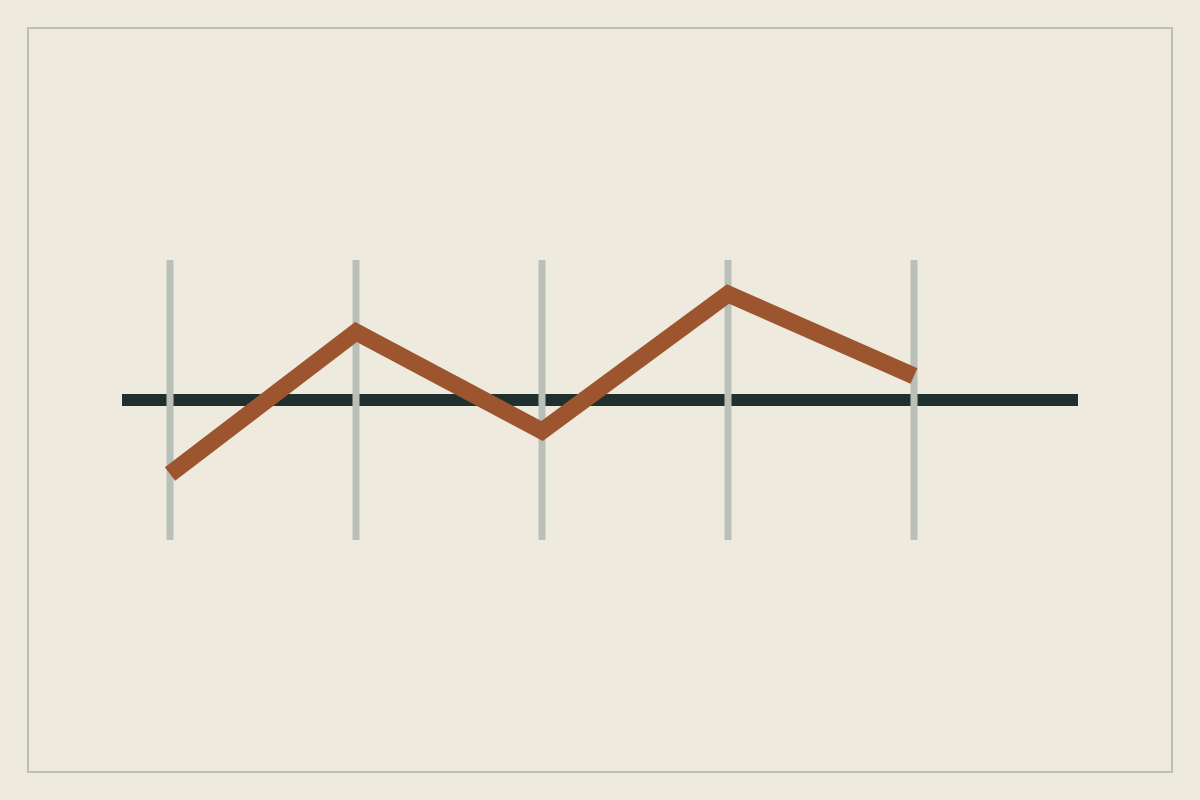
The time window is part of the claim
A snapshot describes a particular period, and the story may change with the chosen beginning or end. One observation cannot become a trend without additional evidence.
Download SVG study ↓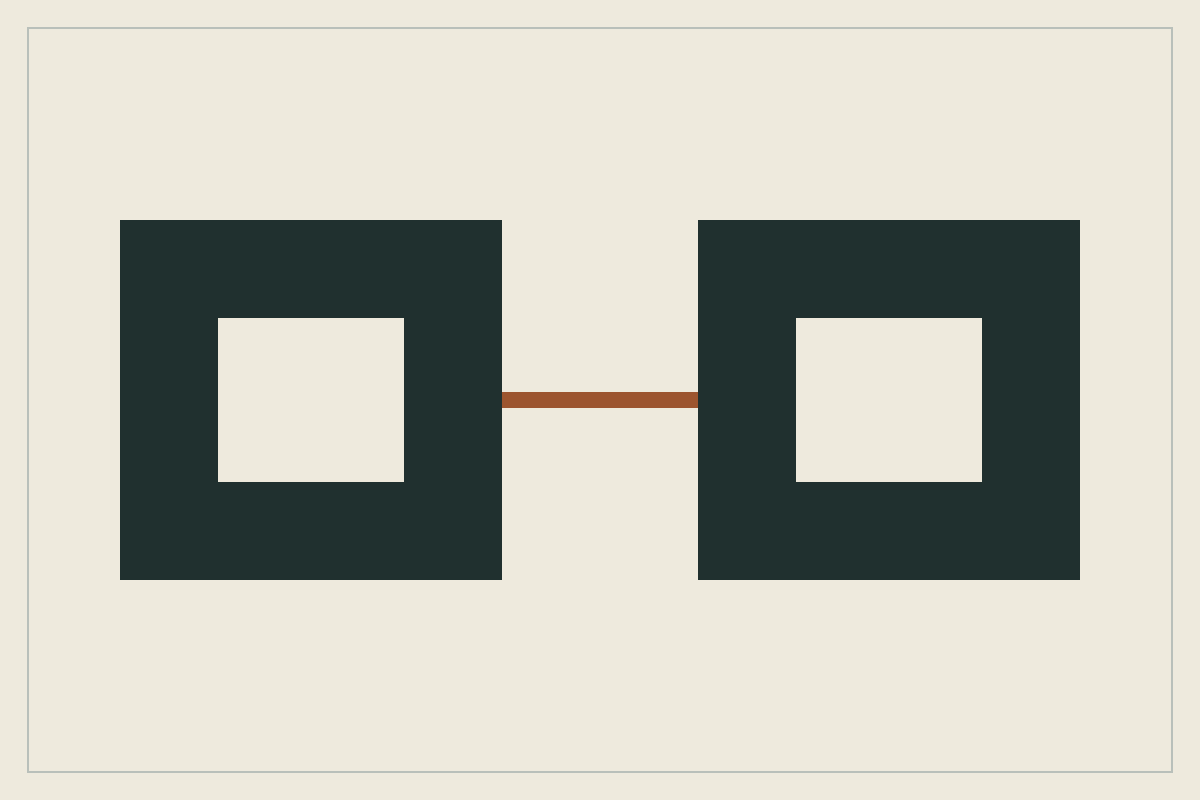
Comparison requires shared conditions
Similar labels or numbers do not make two groups comparable. Population, definition, collection method, and period must be examined before the difference is interpreted.
Download SVG study ↓
The boundary of causality
An indicator can move after an intervention without the intervention causing the movement. The study separates describing change from attributing that change to a particular decision.
Download SVG study ↓
A decision after all five tests
After denominator, definition, time, comparison, and causality are examined, judgment remains a responsibility rather than an automatic output. The decision weighs evidential strength, the cost of error, and reversibility.
Download SVG study ↓Six small arguments
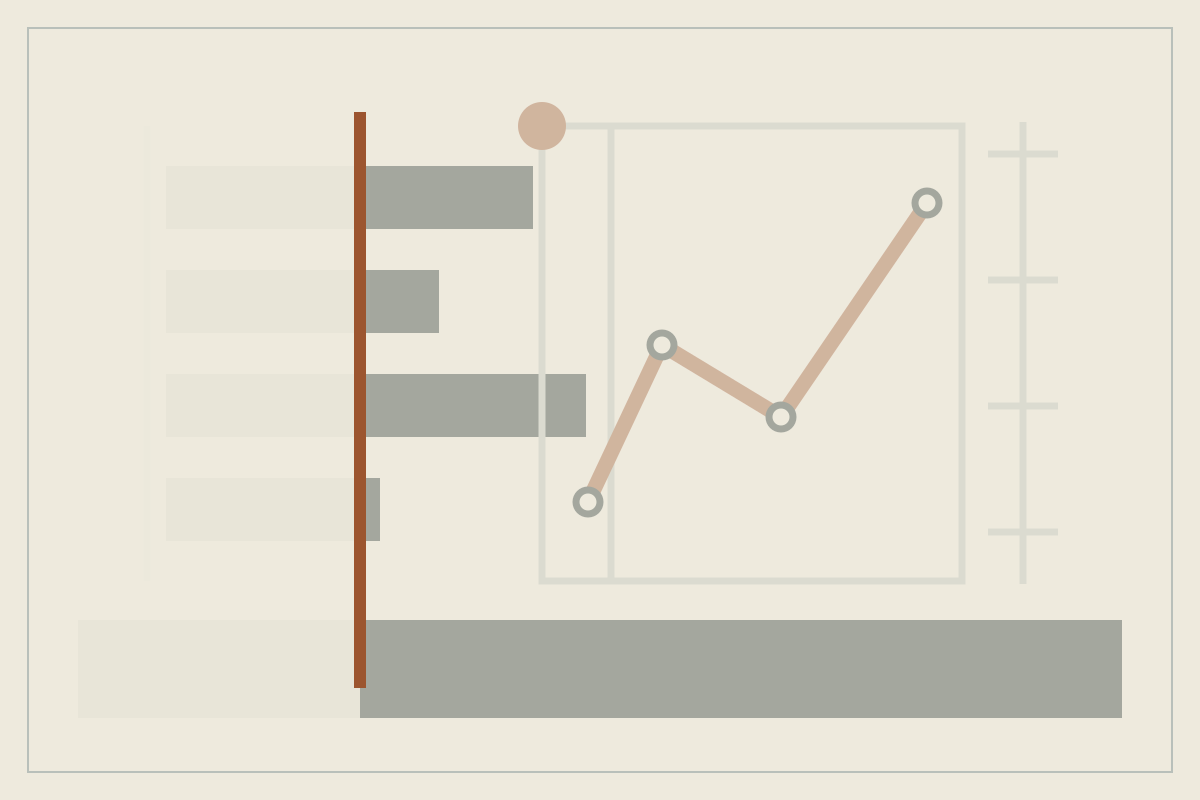
Correct number, wrong decision
Every calculation may pass while the measured concept differs from the concept the decision requires.
Download SVG study ↓

Who owns the definition?
Who decided what enters the indicator, where changes are recorded, and who has authority to revise it?
Download SVG study ↓
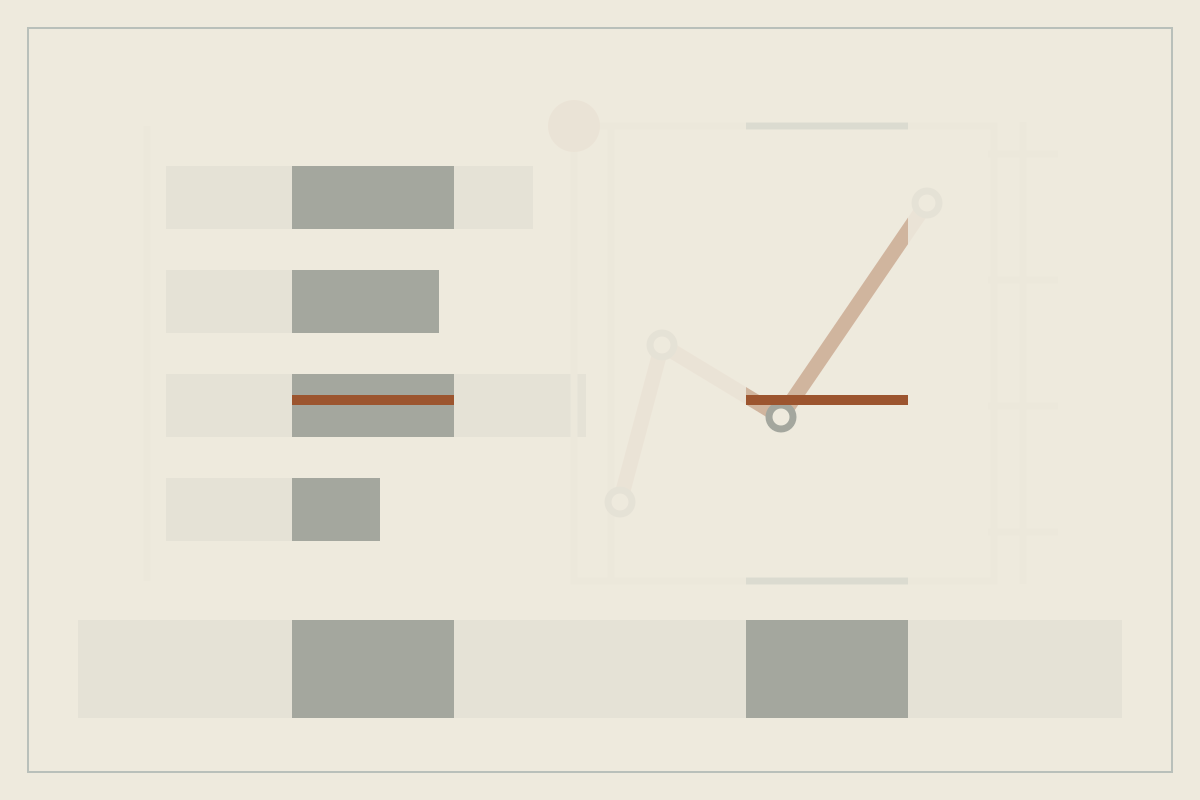
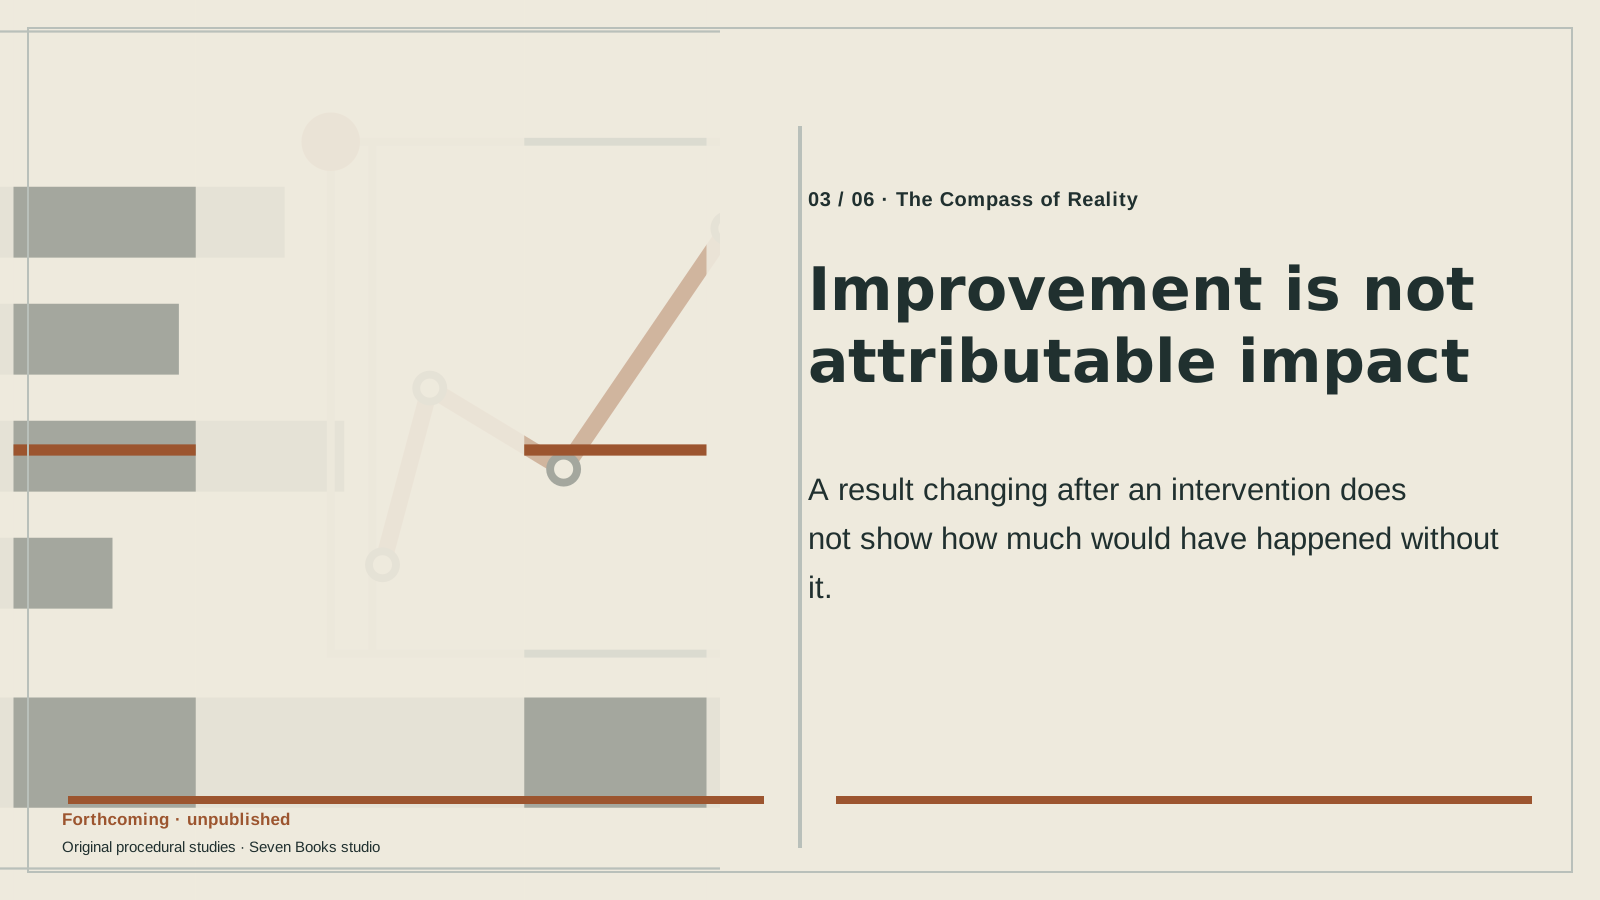
Improvement is not attributable impact
A result changing after an intervention does not show how much would have happened without it.
Download SVG study ↓
Two official numbers, two different questions
Labor-market measures show why two methodologically valid sources may not be averaged or ranked by recency.
Download SVG study ↓
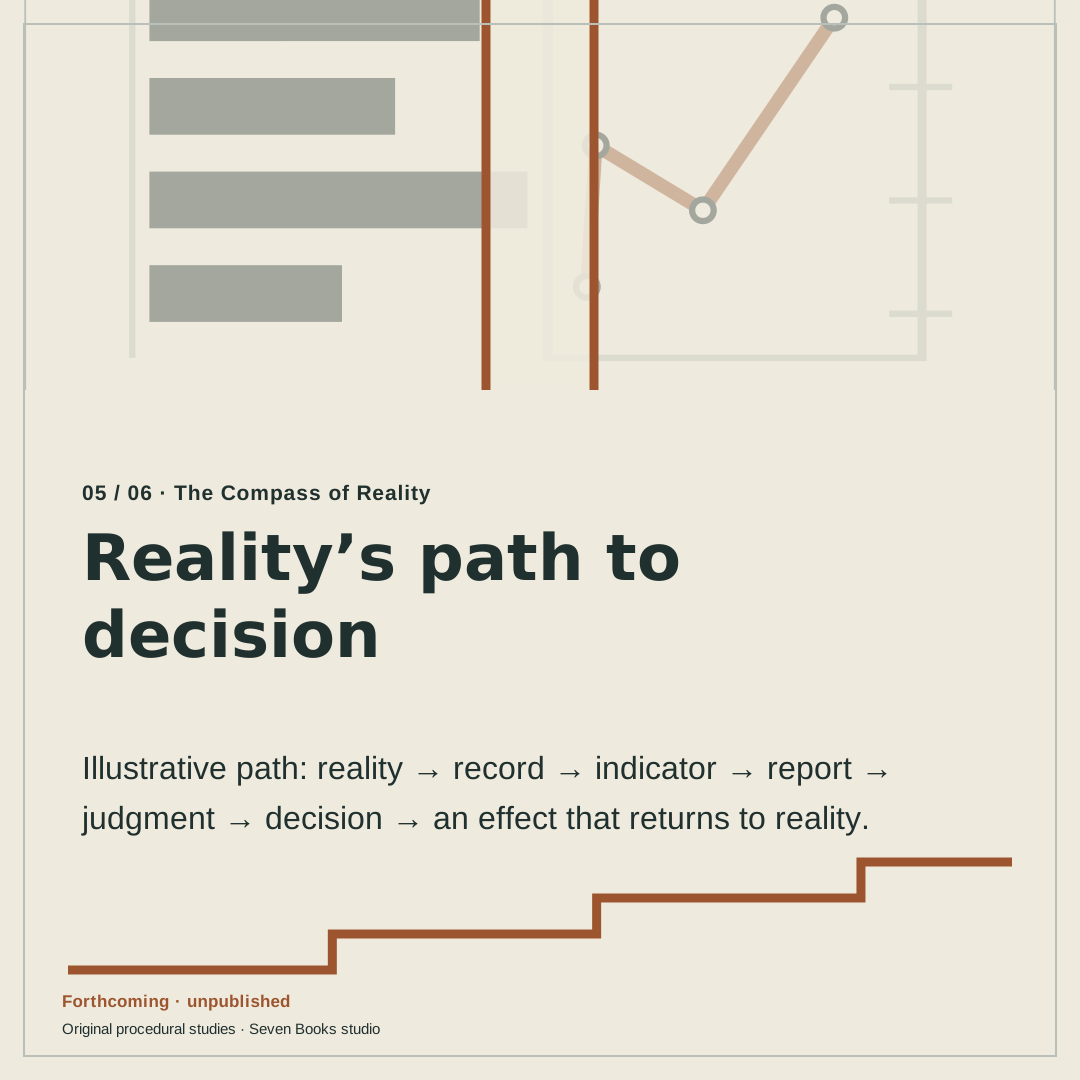
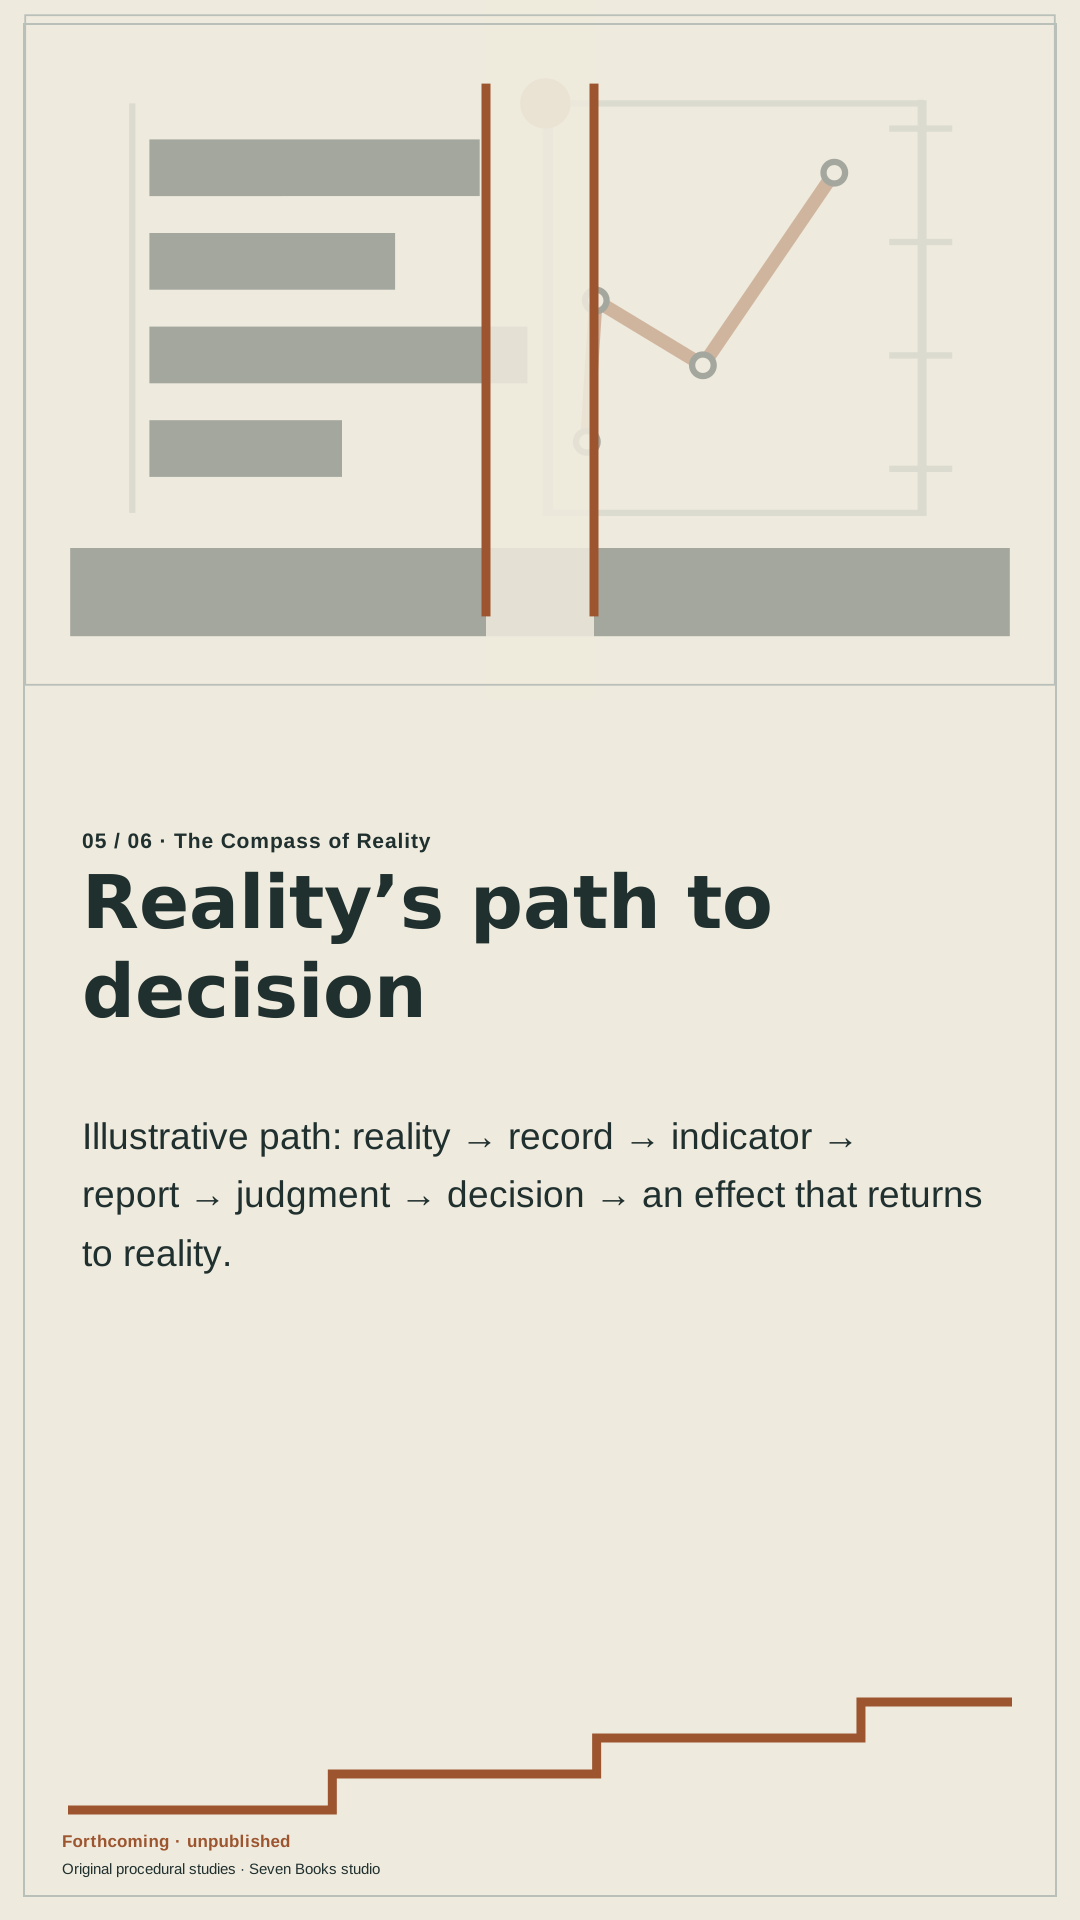
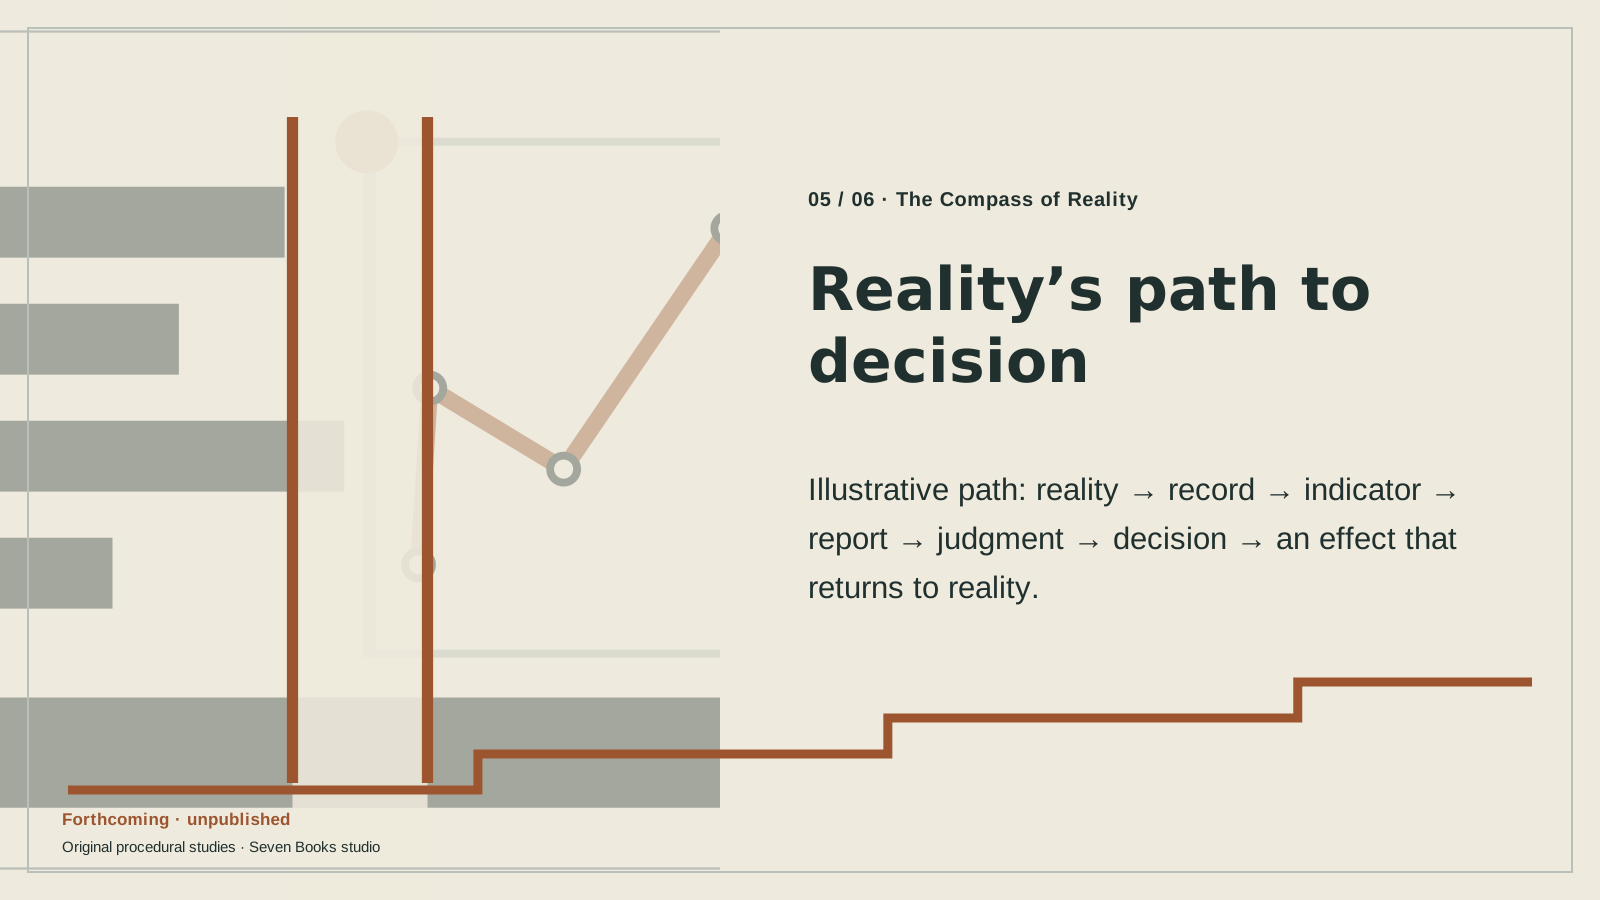
Reality’s path to decision
Illustrative path: reality → record → indicator → report → judgment → decision → an effect that returns to reality.
Download SVG study ↓
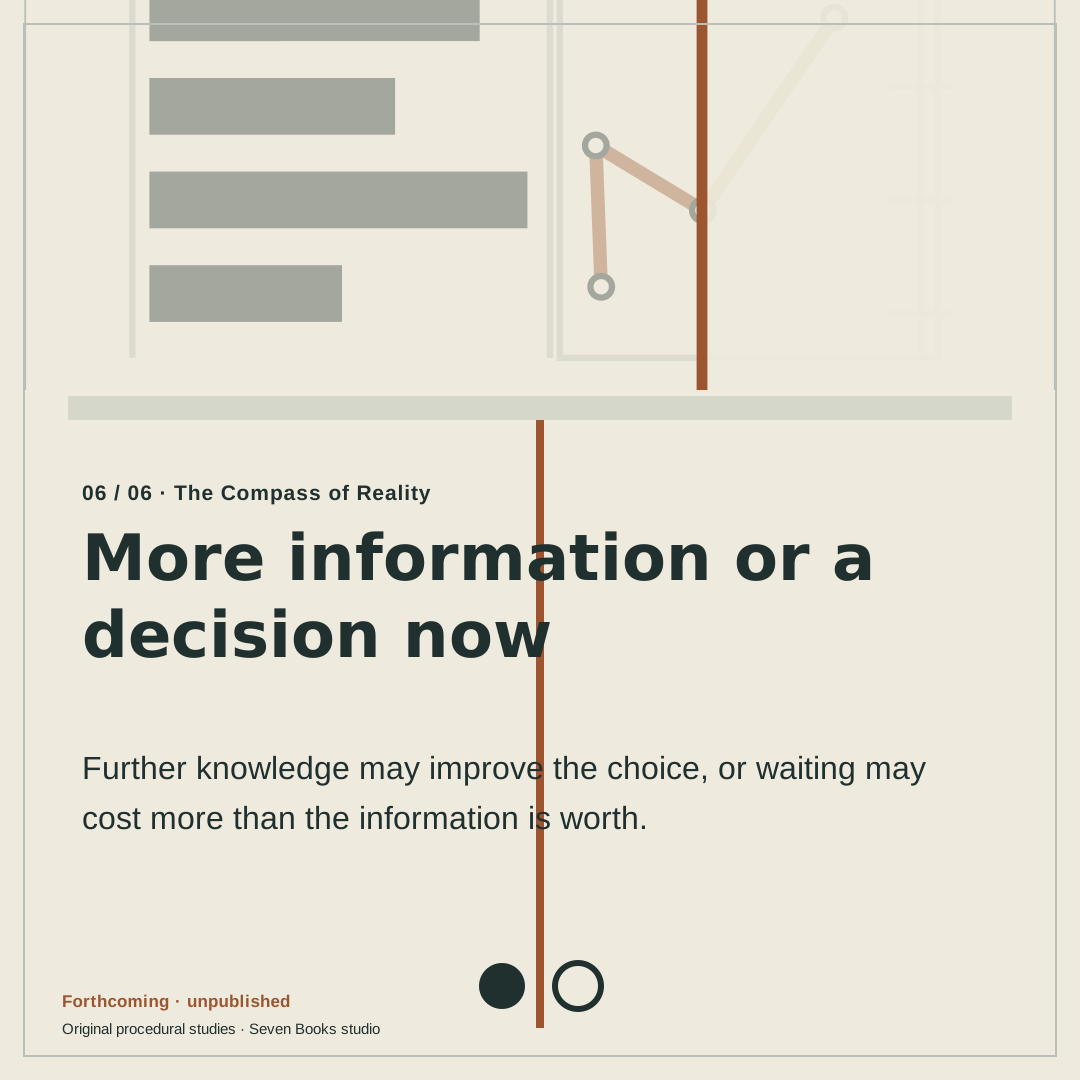
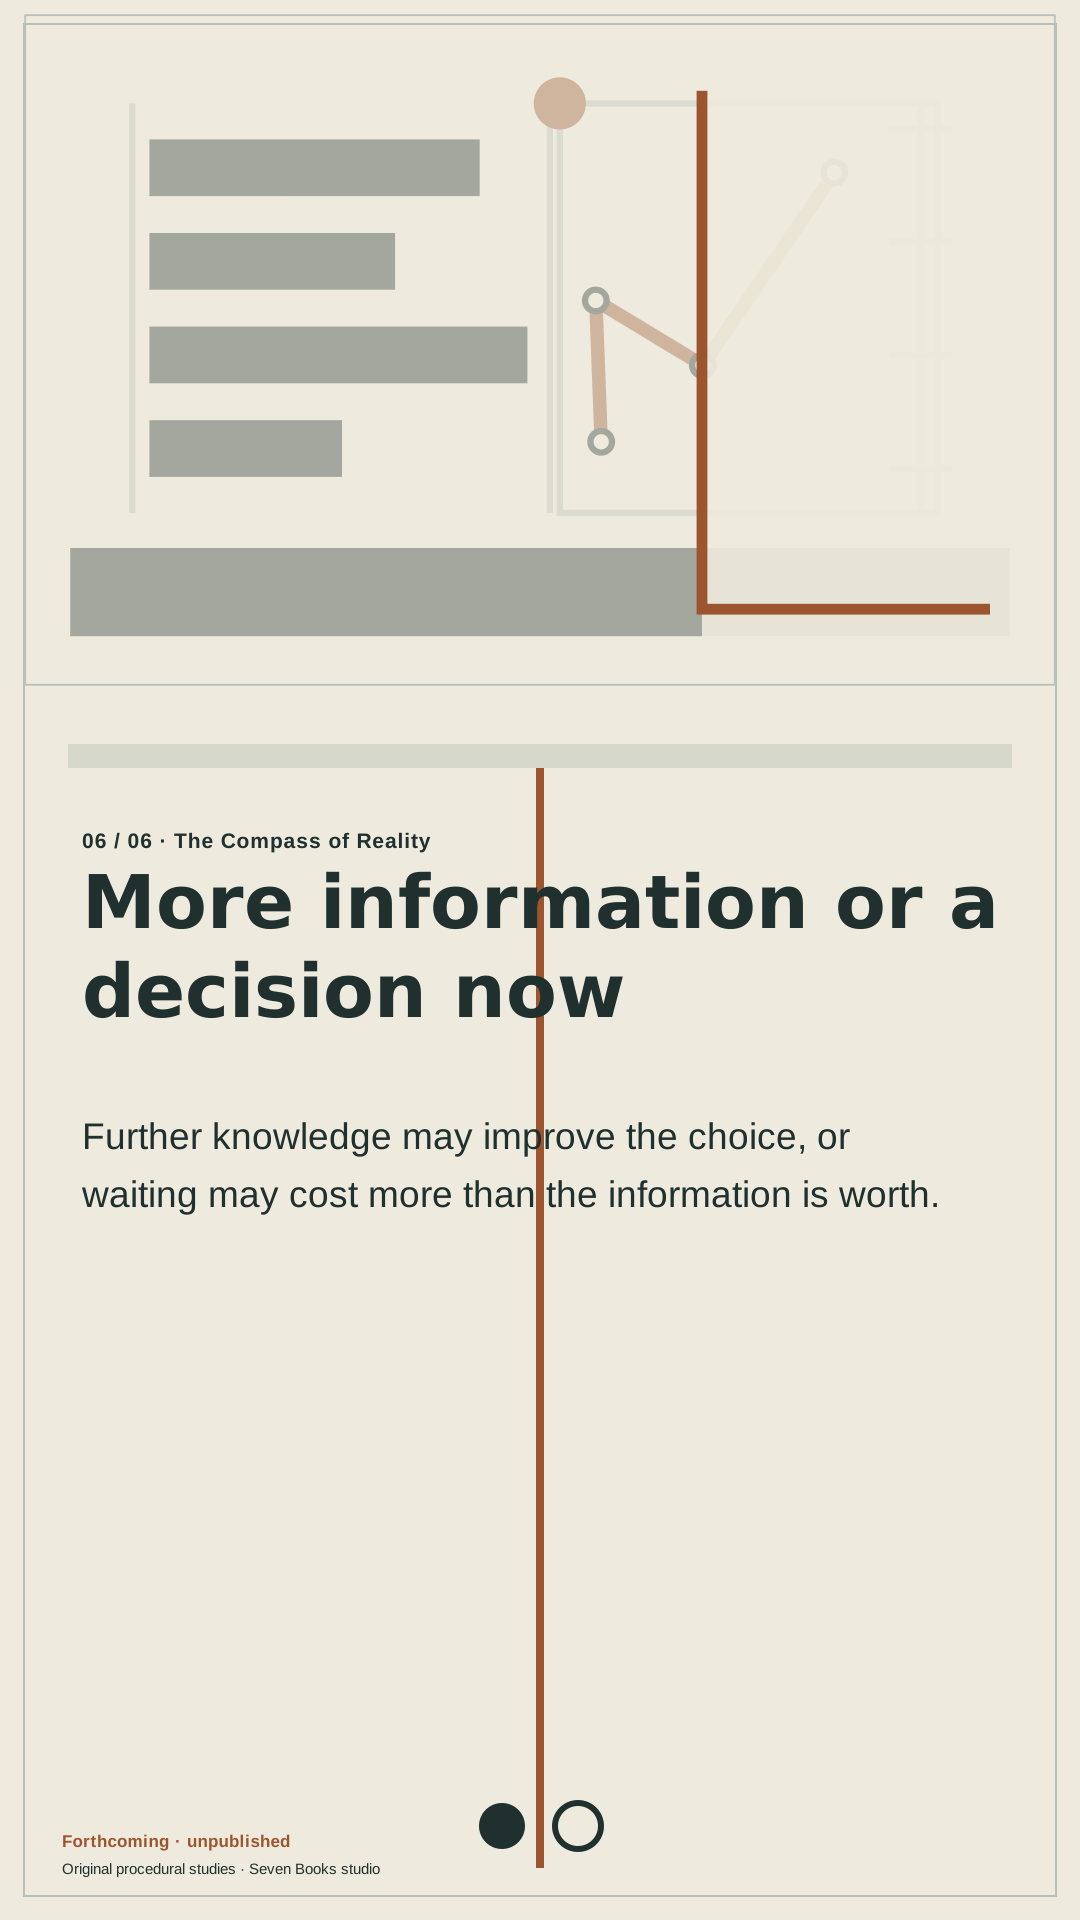
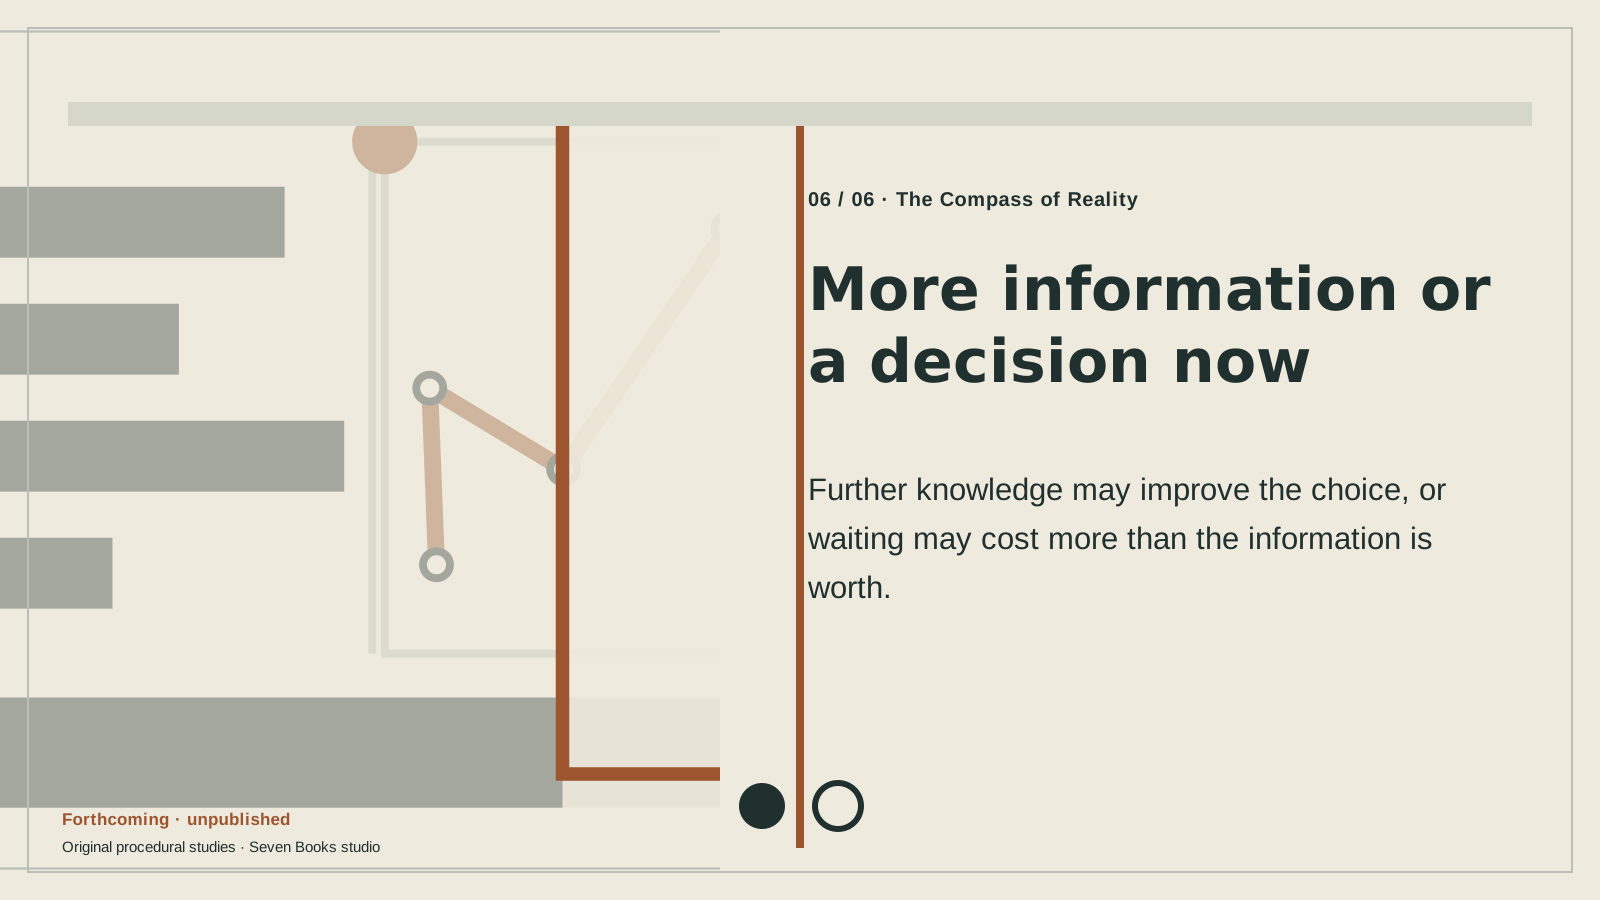
More information or a decision now
Further knowledge may improve the choice, or waiting may cost more than the information is worth.
Download SVG study ↓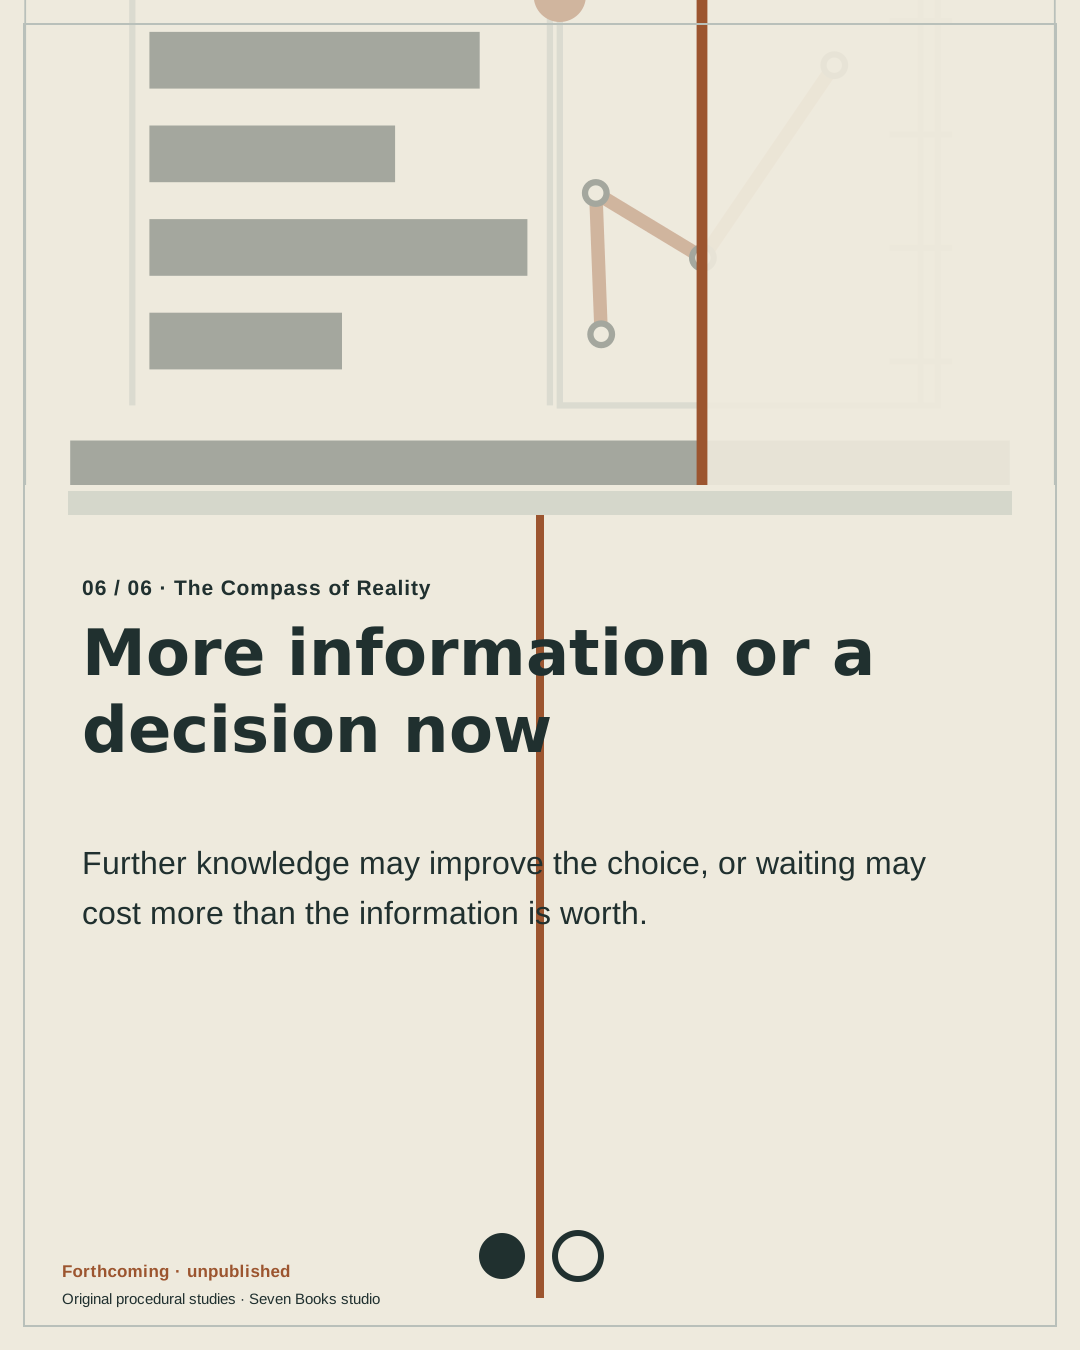
Original procedural studies · Seven Books studio · Project-original procedural geometry
Continue the question
Beyond Digital Transformation
How does an institution change when producing knowledge becomes cheaper while verification costs and decision responsibility remain?
05Hinges of Power
Does power lie in owning a resource, or in moving, stopping, and restoring it while a decision still matters?
06What We Do Not Say
How can we understand people when speech does not equal action, behavior does not reveal motive, and some people never enter the measurement?
JournalData Frames the Decision; It Does Not Make It
Measurements can improve attention while leaving context, values, and responsibility for a decision unresolved.
When the work becomes available
Choose the books you want to hear about. A confirmation email verifies your address before any release notice is sent.
Publication notifications are not open yet. No address is collected here.
Privacy and consent ↗