
English edition of the exploratory research paper. Editorial date: 23 October 2026.
Keywords satellite economic nowcasting · nighttime lights · Saudi economy · VIIRS Black Marble · real-time data vintages · concept drift · cultural lighting patterns · synthetic backtesting
In this article
A methodological paper and reproducible synthetic computational experiment
Conditional Predictive Value of Satellite Nighttime Lights for Saudi Economic Nowcasting: A Critical Evidence Review and Reproducible Synthetic Experiment
Work classification: Hybrid working paper: a bounded critical evidence review and an executed synthetic computational experiment, with a proposed Saudi empirical validation protocol. It is not an empirical measurement paper on Saudi GDP, a comprehensive systematic review, or a peer-reviewed study.
Status: Complete within its stated limits; the study using actual Saudi data has not been conducted.
Extended abstract
We examine whether satellite-derived nighttime lights (NTL) add independent predictive power to nowcasts of Saudi economic activity, relative to a baseline using the conventional economic information available when an estimate is issued. The study distinguishes among the measurement of radiance, inference about social activity or energy use, and prediction of an official economic variable. We review foundational evidence in space-based economics, the properties of NASA Black Marble products, the global study of observed lighting volatility published in 2026, and a Saudi seasonal case documented by NASA. We establish a framework that enforces a strict point-in-time information set and respects observational gaps, measurement error and changes in the relationship between light and the economy, or concept drift.
We ran a computer-generated simulation of 180 months using a declared synthetic economic model and the fixed seed 20261026, with a synthetic change in lighting policy or technology at month 116. Before the change, mean absolute error (MAE) fell from 0.7116 in the conventional economic baseline to 0.5896 after adding light. After the change, error rose from 0.7840 to 0.8620 when light was added without representing the lighting-regime shift, while a model including a declared indicator for that shift achieved 0.6370. These results are conditional on one data-generating process; they do not mean that light improves or impairs estimates of the actual Saudi economy. The methodological conclusion is that a satellite indicator's value must be tested incrementally against an economic baseline, at real release dates, and across changes in lighting regimes, with the prediction target kept separate from the physical phenomenon observed. We conclude by proposing a Saudi study using open satellite data, official economic data and actual seasons, governed by rules that could disprove the central hypothesis.
Keywords: nowcasting; nighttime lights; data vintages; distribution shift; VIIRS; Earth observation; Saudi non-oil economy; data leakage.
English abstract
This hybrid working paper asks whether satellite-derived nighttime lights (NTL) offer incremental real-time predictive value for Saudi economic nowcasting beyond a credible conventional-data baseline. We separate measured radiance, inferred human activity, and formal economic targets; review core evidence on NTL measurement error, seasonal cultural light signatures, and high-frequency illumination change; and specify data-vintage and product-quality constraints. We implement a reproducible wholly synthetic 180-month simulation, with a declared lighting-regime change at synthetic month 116 and a two-month target-release lag. Before this change, adding NTL improves mean absolute error from 0.7116 to 0.5896 index points. After the change, naive NTL inclusion increases MAE from 0.7840 to 0.8620, while a model incorporating an observed lighting-policy indicator yields 0.6370. These conditional model outputs are not estimates of Saudi activity and cannot establish real-world model superiority. We provide a falsifiable Saudi empirical protocol, point-in-time release rules, alternative explanations, and reproducibility files.
Keywords: economic nowcasting; nighttime lights; VIIRS; Saudi Arabia; real-time backtesting; proxy validity; concept drift; measurement error; synthetic experiment.
1. The Question an Image Must Not Answer Alone
The research question is: Does the out-of-sample error in estimates of as-yet-unpublished Saudi economic activity fall reproducibly when nighttime remote-sensing information is added to the conventional indicators that were actually available when the estimate was issued? The question does not ask whether imagery contains information about people; within limits, that is established. It asks whether the signal adds realised predictive value in a setting with specific geographic, institutional and temporal properties.
The proposed unit of analysis for the empirical study is Saudi region × month or quarter, depending on whether an independently measured target variable is published at a consistent aggregate level. If only quarterly national GDP is available, the Saudi unit becomes Kingdom × quarter. Hundreds of thousands of pixels must not be presented as hundreds of thousands of independent GDP values. Pixels may be used to construct explanatory variables, but they do not create independent validation units for an aggregate target.
This study concerns space, sensing and the validity of economic knowledge. It considers three potentially conflicting propositions: (a) satellite signals add information about activity that conventional data miss; (b) their information is an expensive duplication of what faster or better series already provide; and (c) the sign of their contribution changes when lighting patterns, energy use or the structure of the economy shifts. Listing these possibilities is not a theoretical vote among them. Only external testing can constrain the answer.
The alternative hypothesis (H1) is that out-of-sample mean error is lower when the satellite variable is added to the baseline, over a pre-specified period and spatial domain. The operational null (H0) is that the difference is unstable or too small to justify the cost of data and processing. The strongest rival explanation is that apparent improvement comes from changes in samples, the use of a product revised later, differences among activity measures, or an improperly weak comparison baseline.
2. Evidence Review: What Have the Studies Actually Established?
In their 2012 study, Henderson, Storeygard and Weil proposed combining nighttime-activity data with income statistics in a measurement-error model that requires an assumption about the relationship between error in light and error in the national accounts. The paper showed how different signals could help estimate activity where official spatial measurement is difficult, particularly in applications in sub-Saharan Africa. Transferring that result to contemporary Saudi Arabia requires an explicit justification. Statistical-system quality, the composition of oil and services, lighting intensity and the density of visually hidden work are not constant across places S04.
The World Bank paper “Measuring Quarterly Economic Growth from Outer Space” extended the treatment of uncertainty in lights, using the number of valid nighttime observations and spatial and temporal factors to understand measurement error. In one regression specification, the temporal relationship between changes in lights and output was statistically insignificant when country fixed effects were used without time effects, while the relationship improved after time effects were included. This was not a future-facing Saudi prediction comparison. It is an empirical warning against turning a coefficient from an international panel into a persistent ability to sense local monthly change S05.
In a Moroccan case during the COVID-19 pandemic, World Bank research material reported that raw light contaminated by temporary signals showed no significant predictive relationship with output during the test period, while cleaning the observations produced a stronger relationship; nighttime lighting also fell sharply after restrictions were introduced in 2020. These findings must be read in their source context, including local definitions of cleaning, lockdown stages and reporting. They show that signal-extraction design changes the conclusion, not a conversion coefficient that can be carried into another economy S12.
Román and Stokes, by contrast, studied seasonal lighting in Saudi, Egyptian, Turkish and other cities and found changes associated with social and religious behaviour. NASA reported that Saudi cities such as Riyadh and Jeddah were around 60–100% brighter during Ramadan in some measurements. This is evidence that the indicator responds to social patterns, not a measure of Ramadan spending or proof that light is completely detached from economic activity. The two may move together by different degrees S02S01.
In April 2026, Li and colleagues presented a high-frequency global estimate of changes in artificial light at night (ALAN) between 2014 and 2022, including total increases in some regions and offsetting decreases in others. The mechanisms discussed include expansion of human activity, changes in lighting technology, consumption-reduction measures, crises and wars. This finding is particularly relevant because it indicates that the assumed coefficients linking light and activity are not stable over time, even if the sensor remains physically calibrated S08.
NASA's Collection 2.0 Black Marble guide defines observation, correction and estimate-quality products, including the fact that some daily values are filled from earlier observations rather than newly observed that day. Researchers must therefore use the latest high-quality retrieval layers and pixel-quality flags instead of treating every temporally gap-filled value as continuously arriving new information. Good data explain what was not observed as well as measuring what was S06S07.
Desk-research limit: We did not conduct a comprehensive systematic review under PRISMA 2020 or calculate a pooled effect of NTL on the accuracy of Saudi estimates. We selected foundational references, an original technical source, two applied studies and a documented social case relevant to the measurement question. By the cutoff date, we had not found a published test that we could verify as satisfying every condition of our proposed Saudi design. Failure to find one is not proof of scientific absence.
3. From Measurement to Inference: A Three-Layer Model
We separate variables that must not be conflated: , the target economic activity in region and period , as later defined by official statistics; , a potentially relevant human activity, energy use or social practice; and , the nighttime radiance produced by the processed satellite measurement pipeline. Light may be related to the economy through human activity, but it also responds to lighting technology , calendar effects , observation quality , spatial properties , and light sources that are not directly related to the target:
This does not imply that is a complete function of output, because different kinds of activity do not translate into value added with the same coefficient. A factory may increase production without new lighting, and a community may stay awake longer without doubling wages. In an operational model, we want to test:
Here, is the issue time; is the set of conventional variables available at ; and represents factors shifting the lighting regime if they could be observed at the time. must not contain a product published after , no matter how old its acquisition date appears in today's archive.
Mechanisms of Expected Bias
- Confounding: Visitor seasons affect light and some kinds of spending, but the response coefficients differ, and lighting habits may move independently of spending.
- Technology shift: An LED transition or dimming policy can change observed radiance without an equivalent change in service or income.
- Proxy mismatch: Lighting imagery may suit the location of urbanisation or electricity access while providing weaker inference about financial-services and software output.
- Observation selection: Valid nights are not always randomly distributed; cloud, timing and seasons correlate with geography and urban life.
- Spatial dependence: Variation across millions of pixels is not millions of independent economic observations; behaviour, weather and lighting spread across connected areas.
- Vintage contamination: Using final revised versions of an output or satellite product that were not historically available changes the experiment from nowcasting to retrospective explanation.
4. Design of the Executed Computational Experiment
4.1 Why We Used Synthetic Data
The scientific objective is to test whether predictive value can reverse when a light source changes independently of activity, while protecting the boundary between earlier and later information. This assignment did not download a Saudi-wide VNP46A2 series, assemble a true series of historical GDP-release vintages, or run an actual comparison on the Saudi economy. Constructing Saudi numbers without those elements would be fabrication. We instead publish a small experiment with visible assumptions so that readers can see what the computational tool can and cannot establish.
4.2 Generating the Series and Introducing the Shift
We created consecutive monthly periods with synthetic numbers and no dates tied to real events. The random seed is fixed at , using the NumPy random-number generator. Latent true activity follows a seasonal autoregressive process:
We then construct a conventional indicator available in the current month:
And a hypothetical satellite indicator before quality treatment:
The terms are drawn from independent standard normal distributions in the order fixed by the code. A synthetic binary quality flag is generated as , and low-quality readings receive additional noise . This flag is not NASA QA and does not represent actual cloud shares. Its purpose is to show why observation quality and the economic relationship must be kept separate. Nor does the value mean that an LED transition reduces Saudi light by that amount. It is an experimental coefficient chosen to create a measurable structural break.
4.3 Comparison Rules and Protection Against Future Knowledge
When an estimate is issued for synthetic month , official activity values are available only through . Training data therefore end at , even though the generated file now contains the value for . Each experiment uses ordinary least squares (OLS) with an expanding training window. Evaluation begins at month and ends at , allowing the invalid “leakage” variant to read solely to expose experimental contamination. All models share an intercept, , and . They differ only in their additional signals:
| Model | Inputs beyond the common baseline | Information validity at issue time |
|---|---|---|
| Conventional baseline | None | Valid under the assumptions |
| Naive light addition (Satellite) | Valid under the assumptions | |
| Regime-adjusted light | and an indicator that the shift has occurred, | Valid, provided news of the lighting shift was available at the time |
| Deliberate leakage test | Invalid; uses a future observation |
At the start of the shift, the third model does not know the size of the effect. It learns the coefficient on the new variable once the training window contains enough post-shift observations. The code declares the source, type and assumed availability date of every variable. All loop outputs appear in data/synthetic_monthly_predictions.csv, from which the metrics in the following sections were calculated.
5. Results Actually Computed
Mean absolute error (MAE), root mean squared error (RMSE) and mean bias were calculated by subtracting the synthetic true value from each estimate. We did not calculate confidence intervals or statistical-significance tests because one generated experiment cannot support inference about a population outside that simulation. The following values were computed by the execution code and rounded to four decimal places in synthetic index points.
| Period | Model | Number of estimates | MAE | RMSE | Bias |
|---|---|---|---|---|---|
| Pre-shift | Conventional | 51 | 0.7116 | 0.9227 | +0.0087 |
| Pre-shift | Naive light | 51 | 0.5896 | 0.7266 | −0.0525 |
| Pre-shift | Regime-adjusted light | 51 | 0.5896 | 0.7266 | −0.0525 |
| Post-shift | Conventional | 63 | 0.7840 | 0.9488 | −0.0295 |
| Post-shift | Naive light | 63 | 0.8620 | 1.0987 | −0.5693 |
| Post-shift | Regime-adjusted light | 63 | 0.6370 | 0.8018 | +0.1177 |
| All periods | Conventional | 114 | 0.7516 | 0.9372 | −0.0124 |
| All periods | Naive light | 114 | 0.7402 | 0.9504 | −0.3381 |
| All periods | Regime-adjusted light | 114 | 0.6158 | 0.7691 | +0.0416 |
| All periods | Invalid leakage model | 114 | 0.7570 | 0.9700 | −0.3132 |
The results illustrate three distinct mechanisms. First, the synthetic satellite indicator contains a real signal about , so it helps while the relationship is stable. Second, lowering light while leaving the activity-generating equation unchanged introduces systematic measurement drift. Naive reliance then produces larger downward errors in activity and worsens performance despite the earlier relationship. Third, identifying and incorporating the shift can allow the model to adapt. Yet the added binary indicator knows that the shift occurred, information that may be difficult to collect comprehensively in reality. Knowing that a shift occurred is not knowing the size of its effect, nor does it guarantee correction for every spectral or social change.
Relative to the baseline, the pre-shift MAE improvement is , or an error reduction of about 17.1%. After the shift, naive light raises error by , or about 9.9%, while the model tagged with the shift event reduces error by , or 18.8%. These percentages belong to a deliberately generated experiment and must not be transferred to expected performance in the Kingdom.
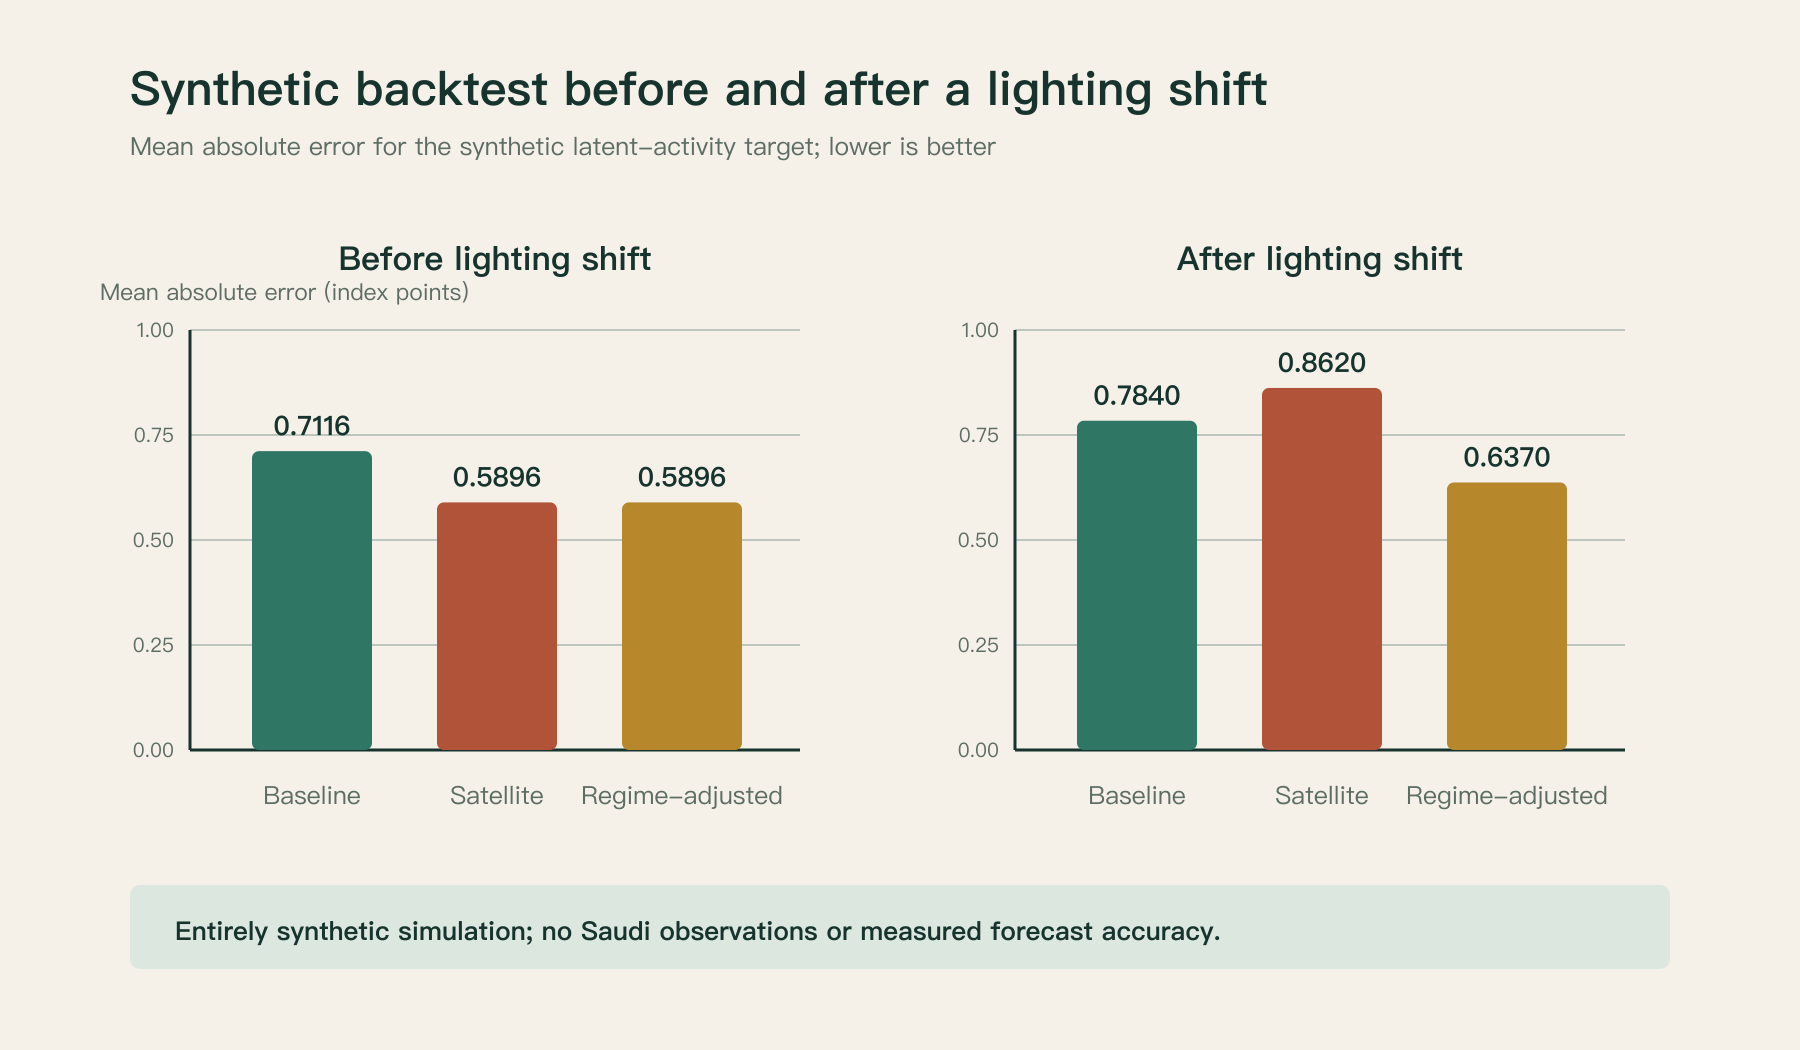
Figure R1. Mean absolute error in the two phases, taken directly from the computational file; no Saudi satellite or economic measurement underlies the bars.
What did this run fail to establish? It did not show that light can forecast Saudi GDP, that more complex models are better, or that lamp replacement has a particular effect size in the real world. We did not run a multi-seed Monte Carlo simulation to measure dispersion. Its absence prevents generalisation even to all series produced by the same equations. The conventional indicator is generated as directly related to true activity and is much better than some real available data, perhaps worse than others. We therefore treat the test as a computational proof that the comparative verdict can reverse, not evidence of a particular degree of reversal or the superiority of a research product offered in the market.
The invalid variant using part of observation did not outperform the baseline here. It remains an example of an invalid experiment if described as a forecast made at time . Had it succeeded numerically, the methodological judgement would be unchanged. Future information does not become a legitimate input because it improves a result, and it is not less dangerous because this computational example failed to reward it.
6. How Do We Turn This Test into a Real Saudi Experiment?
A Saudi protocol must precede any request for a national result. The proposed unit and frame could be “region × month” if a genuine published activity series exists at that level, or “Kingdom × quarter” if the target is real GDP. Aggregation levels must not be mixed, and a sector market must not be measured from the lighting of an entire city. We propose three target levels in order of availability: an aggregate productive-activity index for a region or sector, an aggregate trade and transport index across a group of entry points, and a national economic indicator from the official accounts. Each target requires its own model and release window.
6.1 Accessing Lighting Data
The primary source is NASA's nighttime products. Researchers should preserve the full product name, collection, sensor and orbital platform, scene period, coverage, cell resolution, bands and quality information. For VNP46A2, the DNB BRDF-Corrected NTL layer should be read alongside its gap-filled version, the latest high-quality retrieval layer, and the mandatory quality, cloud and snow flags. The monthly VNP46A3 product may be used after checking the meaning of the monthly composite and the quality of the count of nights, rather than treating it as a raw mean equivalent to any independently constructed daily composite S06S07.
Availability-date risks are fundamental. The product guide describes a near-real-time (NRT) route and a science-quality archive with different schedules and processing. Researchers must distinguish a rapid product with limited uses from a scientific product available later. If an estimate was issued on a particular morning, it cannot use a form that entered the data system days later or was reprocessed months later. A file-availability record must be deposited in data_vintage_manifest, not merely an observation date. Some modern download interfaces do not automatically reveal when the first historical version appeared. In that case, the test should be labelled pseudo-real-time rather than presented as a true release simulation.
6.2 Choosing the Right Error Model for Light
Before pixels are aggregated, the study must define policies for the cloud mask, negative or missing values, flares, fires, ships, moonlight reflection and transient light sources. A missing pixel must not become a zero-light or zero-economic value; absence is not darkness. The share of good observational coverage for each region and month can be reported beside the light variable itself. A minimum acceptable coverage threshold should be fixed before target evaluation and tested for sensitivity. Changing the threshold after seeing the results to obtain a more attractive coefficient would introduce researcher degrees of freedom.
Urban-area and water masks should be separated from geographic boundaries, and total radiance compared with mean radiance over a fixed area and the lit-area share. The first is sensitive to regional size, the second to changes in infrastructure and lighting type, and the third to the threshold decision. “The light indicator” must not be generalised as a single quantity with one meaning. Because lit areas move across boundaries, results should be tested for sensitivity to partition edges and boundary buffers.
6.3 The Economic Baseline That Is Hard to Beat
The baseline must use data available at the release time: delayed official accounts together with trade and production indicators published by that date and, subject to licence, aggregate transaction data or demand indicators with declared timing. Private institutional data must not be included without permission or attributed to a public source. A legitimate naive baseline should also be built: continuation of the last published rate, a seasonal factor estimated only through the end of training, then a richer economic baseline using conventional variables. Showing that a satellite beats a weak model without beating the stronger baseline does not establish incremental investment value.
When a quarterly target is constructed from monthly variables, the method of temporal aggregation must be documented precisely. The model must not be given knowledge of the entire group when only one month of the current quarter has passed. Three estimates may be issued at pre-specified dates within each quarter, each with a different information set, and performance compared only among issues with the same timing. The official flash GDP target and the later revised GDP target are distinct versions of the target variable. The study must specify which it seeks to predict and when the second may be used for post-release validation.
6.4 The Saudi Calendar Is Part of the Model Definition
Ramadan, Hajj and holidays belong in Saudi tests because earlier primary evidence linked regional lighting patterns to those seasons S02S01. The design needs the correct start and end dates for each season in each year, not a fixed Gregorian seasonal function. But it is not acceptable to call every seasonal effect “noise to be removed.” Hospitality, transport and retail activity may be real drivers of the measured target. We therefore propose three specifications: a raw light indicator with documented quality; an indicator adjusted for calendar seasons; and an indicator with an interaction term between season and regional function. The conclusion remains conditional on out-of-sample performance for each target class.
An official report of 1,707,301 pilgrims in 2026, including their countries of origin, does not establish Makkah's radiance that season. It allows the definition of a test period connecting official human-mobility data with suitable observational windows. If no valid, homogeneous lighting series or ground-based business indicators are available for validation, the test's weakness must be declared. A photon count cannot be inferred from a pilgrim count by intuition S03.
7. Proposed Measurement and Testing Plan
We call for a prospective protocol that fixes the following before the final test window is opened:
| Element | Initial methodological decision | What would invalidate or constrain it |
|---|---|---|
| Target | Officially measured change in non-oil activity, region × month where data permit | No reliable measure at that detail requires moving to quarter × Kingdom |
| Satellite feature | Corrected VNP46A2/A3 illumination masked by quality flags | Geographic or temporal gaps, or a publication lag incompatible with nowcasting |
| Baseline | Officially delayed value plus conventional indicators available at the time | Must not be replaced by a weaker model merely to enlarge the difference |
| Split | Expanding training windows followed by tests on later periods | Any random mixing of months turns the result into a non-temporal test |
| Primary error | Mean absolute error (MAE) in the target's units | Comparing values with different units or coverage |
| Secondary error | RMSE, bias and uncertainty bounds | One average hides regional errors or reversals |
| Success criterion | A pre-defined, stable reduction after signal cost, with calendar and spatial comparison | One successful year or selecting the best setup after observing it |
| Counter-test | Documented lighting-change periods, different seasons and areas weakly related to light | Insufficient metadata widens uncertainty |
The improvement that would make a product cost-effective should be defined before evaluation with actual users of the estimate. It depends on the type and sensitivity of the decision, not a researcher's preference for a particular number. If real prices and specific decisions are available, a value-of-information curve could relate error reduction to processing cost, availability delay and decision sensitivity. We did not calculate such a curve because the paper lacks operational financial inputs.
We propose testing stability across multiple periods, including years of digital-economy expansion and years of change in energy prices or lighting, without presuming their effect on light. To address differences among cities, a hierarchical model could allow correlation coefficients to vary across regions, with regularisation against overfitting noise and, as far as possible, independent regional test sets. Where sensitive data are collected, the study should use only licensed aggregate activity without exposing critical facilities or operational routes.
8. Robustness Tests and Alternative Explanations
In the empirical phase, the following falsification exercises are mandatory for an economic claim, although they were not conducted here on Saudi data:
- Feature ablation: Compare the light model with its counterpart after removing light, holding all other conditions fixed, then test quality- and calendar-related additions separately.
- Gap-fill robustness: Exclude or down-weight gap-filled nights and compare results with all observations; separate actual cloud noise from changes in light.
- Lighting-technology sensitivity: Include known locations and dates of lamp changes where available, and test whether the coefficient drifts afterwards.
- Spatial holdout: Prevent neighbouring pixels or connected regions from being shared across training and test sets when transferring a model from one region to another.
- Historical vintage replay: Reconstruct the data package available for each estimate, excluding corrected imagery or economic numbers published after the issue date.
- Target sensitivity: Separate non-oil value added from sales or logistics flows, and determine where the signal reaches one target but not another.
- Placebo period: Use a period before the supposed lighting-change event and verify that no “effect” appears before the event when the estimation method assumes one.
- SAR addition: Compare an aggregate urban or port-change signal from radar, under the sensing specifications, with light and ground data without assuming that radar backscatter equals financial activity.
Model confidence must not be derived from the “confidence” of a natural-language generation function. If a model produces a probability distribution, its interval coverage should be tested on future observations, as should performance differences among regions, rather than merely shown in a colour gradient. A concept-drift alert can be built from tests of changing forecast residuals over time, but it requires an alert framework that tolerates false alarms and a design that distinguishes a change in the target from changes in the sensor or in the behaviour of light.
9. Limits of Validity and Transfer to Decisions
This paper contains two different kinds of evidence: published results by others on the role of lights and the mechanisms of their change, and simulation results we executed under a chosen data-generating process. The former does not predetermine how a Saudi observatory would perform after 2026; the latter describes no geographic or economic reality. There is no actual Saudi model test here, no measurement of a satellite's accuracy over a particular city, and no estimate of the size of the informal economy. Respecting these limits keeps the project open to future research instead of closing the question with technical rhetoric.
There is also a causal problem. Adding light may improve a forecast of an economic statistic without light “causing” GDP to rise or fall. A correct prediction cannot automatically evaluate an intervention such as a lamp-replacement project. If a city turns off some signs while the value of its businesses grows, the shutdown did not produce growth merely because the two coincide. If a new city lights up while output changes, investment, production, population and other factors must be studied before assigning cause. Prediction models and causal-evaluation models should be kept in separate files and discussions.
Official economic data are not a binary choice between “truth” and “error.” A statistical agency may revise a preliminary value when newer information arrives or activity is redistributed among sectors. Researchers must decide whether they are predicting the initial release or the latest revised value. Both are valid targets for different purposes. Testing with information from the future of a release and then calling the result an advance forecast is invalid. This is clear in GASTAT's publication of a flash estimate for the second quarter of 2026 on 30 July S10. That date is not a footnote; it enters the equation of what could have been known.
From an investment-strategy perspective, we do not recommend creating a new official light-based output index at this stage. We recommend building a reproducible testing pipeline with a clear target, input vintage and update cost before deciding whether to buy additional data or connect an estimate to a major decision. If several periods show that free public signals are sufficient, there is no commercial case for upgrading to private imagery simply because it has higher resolution. If those signals fail to observe the relevant non-oil activity, research should turn to indicators closer to the economic function in question.
10. The Next Decisive Experiment
We propose a historical test under a prospective, pre-registration-like protocol, without claiming that the present protocol has been formally registered. It would use dozens of actual releases for Saudi regional data over sufficiently long prior periods. Product names, regions, calendar seasons and quality rules would be fixed before the held-out test results were viewed. A point-in-time data store would retain a snapshot of every package and save the official target when released. A team independent of feature optimisation would test the reproducibility of estimate and error files.
Supporting evidence would be repeated improvement over a strong economic baseline, preserved across lighting regimes, seasons and regions, with the benefit calculable before the official indicator appears. Contrary evidence would be improvement disappearing after calendar adjustment or leakage prevention, failing in service regions, breaking after a technology change, or arriving too late because of availability costs. The use case should then move to urban or service monitoring suited to the nature of light, or the economic-forecasting path should be stopped.
The strategic conclusion is not that Saudi Arabia should build a “satellite that reads GDP.” It is that the country could develop a science of alternative-signal diagnostics: software that understands sensor quality, the culture of place, data-availability history and the strength of the economic baseline, then confidently refuses to extract a value the image does not provide. Such a capability could theoretically become a research-software industry serving other markets, but the export hypothesis would itself require customers, independent trials and documented commercial returns rather than advance declarations.
11. Reproducibility, Data and Working Files
The analysis/reproduce.py program generates all series, observation counts and model results without external downloads, using NumPy alone. It writes data/simulation_protocol.json, including the seed, noise scales, synthetic shift date and description of the invalid model. It writes data/synthetic_monthly_predictions.csv for every period and model, with the estimate, target, error and time-validity flag, then aggregates data/backtest_metrics.csv over three windows. The figure_02_regime_backtest graphic is derived from the metrics table without manual re-entry. figure_01_global_light_balance shows values published by Li and colleagues S08; it is not a product derived from downloading satellite imagery for this paper.
The deliverables include an XLSX workbook exposing the base table, quality indicators, computational results and some derived relationships as inspectable formulas. The workbook is not a substitute for the series-generation program or an actual economic test. Its computational version is an additional reproducibility reference. Results can be recalculated after installing dependencies from analysis/requirements.txt and running python analysis/reproduce.py from within the article package. The package contains no confidential Saudi data or original observations of the economic variable.
12. Register of Results and Unresolved Hypotheses
Computed result R-01: In the pre-lighting-change simulation, adding light reduced the error of a specified baseline model. Scope: One data-generating process, one seed and declared coefficients. Why it does not transfer to Saudi Arabia: No actual activity or light data and no historical-vintage series.
Computed result R-02: After light was reduced synthetically without changing the activity equation, naive light became worse than the same baseline in mean absolute error. Scope: A chosen shift type and an effect coefficient of four units.
Computed result R-03: A model told that a shift occurred can learn a coefficient that helps it avoid part of the performance loss. Scope: A known event variable available at the time; we do not guarantee its global availability or completeness.
Published observation E-01: Genuine global variation in the causes of increasing and decreasing illumination over 2014–2022, according to the Nature study S08. What it does not establish: The direction of Saudi growth or the accuracy of estimation from orbit.
Published observation E-02: Changes in Saudi-city illumination during Ramadan in the NASA study S02S01. What it does not establish: The rate of change in output, total consumption or welfare.
Working hypothesis H-01: Estimates of some spatial Saudi activities may improve when high-quality light signals are included after controlling for the calendar and lighting changes. Disconfirming evidence: Failure to show stable improvement over a strong ground-data baseline in genuine future-facing test periods.
Working hypothesis H-02: Satellite evidence may be useful for following spatial or operational changes even when it is weak at forecasting national output. Disconfirming evidence in a given use case: Failure to establish proxy validity for that specific target after linking the signal to independent observations.
These records are not probabilistic forecasts and contain no numerical probability for the scenarios. The paper has not registered a dated prediction of a future economic outcome. When the actual observatory phase begins, the date, settlement rule and information vintage of every prediction must be recorded before the outcome occurs.
13. Scientific References and Primary Documents
- S04 Henderson, J. Vernon; Storeygard, Adam; Weil, David N. (2012). Measuring Economic Growth from Outer Space. American Economic Review 102(2), 994–1028. https://doi.org/10.1257/aer.102.2.994
- S05 World Bank. (2022). Measuring Quarterly Economic Growth from Outer Space. Research paper. https://documents1.worldbank.org/curated/en/692011641480491613/pdf/Measuring-Quarterly-Economic-Growth-from-Outer-Space.pdf
- S12 World Bank Development Impact. (2021). Tracking Economic Activity in Response to the COVID-19 Crisis Using Night Lights: The Case of Morocco. https://blogs.worldbank.org/en/developmenttalk/tracking-economic-activity-response-covid-19-crisis-using-night-lights-case-morocco
- S02 Román, Miguel O.; Stokes, Eleanor C. (2015). Holidays in Lights: Tracking Cultural Patterns in Demand for Energy Services. Earth's Future 3, 182–205. https://doi.org/10.1002/2014EF000285
- S01 NASA Earth Observatory. (2015). The Lights of Ramadan and Eid al-Fitr. https://science.nasa.gov/earth/earth-observatory/the-lights-of-ramadan-and-eid-al-fitr-84923/
- S08 Li, Tian et al. (2026). Satellite Imagery Reveals Increasing Volatility in Human Night-time Activity. Nature 652, 379–386. https://doi.org/10.1038/s41586-026-10260-w
- S06 NASA Goddard Space Flight Center. Black Marble Product. https://viirsland.gsfc.nasa.gov/Products/NASA/BlackMarble.html
- S07 NASA. (October 2024). Black Marble User Guide, Collection 2.0. https://viirsland.gsfc.nasa.gov/PDF/BlackMarbleUserGuide_Collection2.0.pdf
- S03 Saudi Press Agency. (2026). GASTAT: Total Number of Pilgrims for Hajj 2026 Reaches 1,707,301. https://www.spa.gov.sa/en/N2599493
- S10 General Authority for Statistics. (30 July 2026). GDP: Flash Estimate Q2/2026. https://www.stats.gov.sa/en/search-publication?category=publication&delta=4&q=الناتج+المحلي+الإجمالي
- S11 European Space Agency. Sentinel-1: Radar Vision for Copernicus. https://www.esa.int/Applications/Observing_the_Earth/Copernicus/Sentinel-1
- S09 Bará, Salvador; Castro-Torres, José J. (2024). Diverging Evolution of Light Pollution Indicators: Can the Globe at Night and VIIRS-DNB Measurements Be Reconciled? Author manuscript. https://arxiv.org/abs/2409.13111
Ethical and procedural statement: This text was generated with documented editorial responsibility. No actual researchers from the institutions named participated in the study; no interviews or simulations of real shocks to Saudi Arabia were conducted; and the study neither accessed sensitive operational data nor underwent external peer review. The evidence register, references and code are provided to support reproducibility checks and correction of any errors found.