English edition of the original essay. Editorial date: 23 October 2026.
Keywords satellite economic nowcasting · nighttime lights · Saudi economy · VIIRS Black Marble · real-time data vintages · concept drift · cultural lighting patterns · synthetic backtesting
In this article
Can satellites read the Saudi economy before its statistics arrive?
The Satellite's Economic Illusion: What Nighttime Lights Can—and Cannot—Reveal About Saudi Arabia
Lead: During Ramadan, a city can grow brighter without doubling its productivity. Between a satellite image that captures traces of life and an economic statistic that tries to measure their value, a new science emerges alongside a new source of misunderstanding. This essay begins with a documented Saudi signal and ends with a computational test designed around one question: when do satellites tell us something we did not know, and when do they merely make us more confident in a false story?
1. The Night a Machine Sees an Economic Festival
Before large language models (LLMs) became the subject of every conference, researchers at the National Aeronautics and Space Administration (NASA) were asking an apparently modest question: why do certain cities grow brighter during particular weeks of the year? They were tracking data from the Visible Infrared Imaging Radiometer Suite (VIIRS) aboard the Suomi National Polar-orbiting Partnership satellite (Suomi NPP), comparing what the sensor saw with a social calendar that did not exist inside the satellite itself.
In 2014, NASA presented a striking result: Saudi cities including Riyadh and Jeddah grew roughly 60% to 100% brighter during Ramadan in the team's analysis; the full scientific study appeared in 2015. Saudi Arabia was not an unexplained operational exception. Miguel O. Román and Eleanor C. Stokes found that seasonal light patterns corresponded to social and religious practice in Middle Eastern cities, just as they corresponded to Christmas and New Year celebrations in parts of the United States. The study did not say that gross domestic product had doubled. It said something more precise and more interesting: a city has habits that can leave a photonic signature in the sky S01S02.
As a thought experiment, imagine that an institution has spent a fortune on an economic forecasting system that consumes satellite imagery and observes an 80% rise in illumination. If the system knows nothing about the social calendar, the character of local lighting or shifts in the hours of activity, it may produce a highly confident report about a surge in output. The report will look modern. Its dashboard will be attractive. It may include a chart with several decimal places. Those decimals will not reveal that the model understood the lamps and forgot the people who switched them on.
In fairness, Ramadan also brings real economic activity. Restaurants, markets, transport and hospitality may all change their operating patterns. But the percentage increase in light is not the percentage increase in the value produced by those activities. The scientific distinction is not between an “economic event” and a “cultural event.” It is between a measured phenomenon and an inferred quantity that requires a testable statistical relationship. In a society where activity shifts between daylight and night, ignoring culture can become a data-engineering error before it becomes a gap in general knowledge.
During the 2026 Hajj season, the General Authority for Statistics (GASTAT), as reported by the Saudi Press Agency (SPA), recorded 1,707,301 pilgrims, of whom 1,546,655 came from outside the Kingdom S03. This is an official count of an enormous movement of people over a short period. It does not permit us to infer the change in Makkah's illumination or economy without actually processing data for those days. Saudi reality therefore offers a potential natural experiment: a documented social variable, a known place and time, and a satellite hypothesis that can be tested rather than a result that may be announced in advance.
2. When the Satellite Corrected a Statistical Error
To understand the idea's appeal, consider the work of J. Vernon Henderson, Adam Storeygard and David N. Weil. In their 2012 American Economic Review paper, “Measuring Economic Growth from Outer Space,” they proposed combining two indicators from different institutional families: national accounts and nighttime lights. One is produced by a human system that collects information about output, prices and transactions. The other comes from a sensor observing optical radiance in particular spectral bands. The point was not that the second is always truthful and the first suspect. It was that the two sometimes make different kinds of error S04.
In a country with weak establishment surveys and limited coverage of informal activity, an image may add an independent observation about where urban settlement is expanding or electricity use is rising. Yet independence is a methodological assumption with conditions. Statistical and satellite errors may overlap. Conflict may affect both. Light may respond to a public-lighting policy that creates no new productive value. The paper was therefore not a licence to replace GDP with a night image. It investigated how measurement might improve when the properties and limits of error are understood.
A later World Bank study, “Measuring Quarterly Economic Growth from Outer Space,” examined data from the second quarter of 2013 through the fourth quarter of 2020 across different economic groups. It found that the direct temporal correlation between changes in lights and changes in output could be weak or statistically insignificant when common time effects were omitted, while the relationship improved in specifications that controlled for those effects. The authors also developed a framework for measurement error and noted that the lights–GDP relationship differs between advanced and developing economies S05.
Marketers do not like this result. The convenient line is, “More lights mean more output.” The paper's result says that correlation across cities is one thing; explaining change in a particular city during a particular month is another. A model can distinguish a large industrial city from a dark village with great accuracy, then fail when asked whether that same industrial city increased its output this quarter. It has memorised an image of wealth without necessarily learning the movement of activity.
3. The Physics Missing from the Chart Title
The Day/Night Band (DNB) sensor observes visible and near-infrared light reaching it from and around Earth's surface. That short sentence conceals a difficult set of distinctions. Light may come from a shopfront, a street or a factory. It may come from a gas flare, a fire, a ship, or moonlight reflected by a cloud. The sensor is not a corporate accountant. It knows radiance, a physical quantity with units and calibrated instruments. It knows nothing of “revenue,” “wages” or “profit” unless we teach it a relationship demonstrated with independent measurements S06.
NASA's Black Marble system addresses this problem through laborious scientific processing. Its daily product, VNP46A2, is not a naive sensor image. It applies corrections for moonlight, the atmosphere and the geometry of illumination and reflection through the bidirectional reflectance distribution function (BRDF). It also provides layers that describe data quality and the latest high-quality observation, and distinguishes processed illumination from values filled algorithmically because an observation is missing S06S07.
A pixel in this product is approximately 500 metres across. That spatial resolution does not show us one bank account or one working computer. Even within half a kilometre, a market façade mixes with the adjacent road, parking areas, public lighting and sources with little direct economic weight. There is another kind of economic resolution that the camera cannot supply: the difference between two neighbouring factories that produce equal value while one uses more light at night.
The satellite product includes a revealing layer called Latest High-Quality Retrieval. When clouds obscure a particular night or a reading fails its quality threshold, processing may use the last reliable measurement or a temporal gap-filling model. Seeing a value under today's date does not always mean that it is a new photonic observation made today. It may be information derived from earlier observations and declared filtering rules. The distinction matters if we claim to detect a surprise that happened last night. Separating the current signal from the filled signal is no technical footnote. It is the difference between a witness who saw the event and one describing the usual habits of the place S07.
4. A 2026 Study: Earth Brightened and Darkened at Once
On 8 April 2026, Tian Li and colleagues published “Satellite Imagery Reveals Increasing Volatility in Human Night-time Activity” in Nature. The team used daily night imagery and continuous change-detection methods to study fluctuations in artificial lighting from 2014 to 2022. The global result is not a line rising calmly. Illumination increased in regions by an amount equal to 34% of total baseline brightness and decreased elsewhere by an amount equal to 18%, leaving a net global increase of 16% S08.
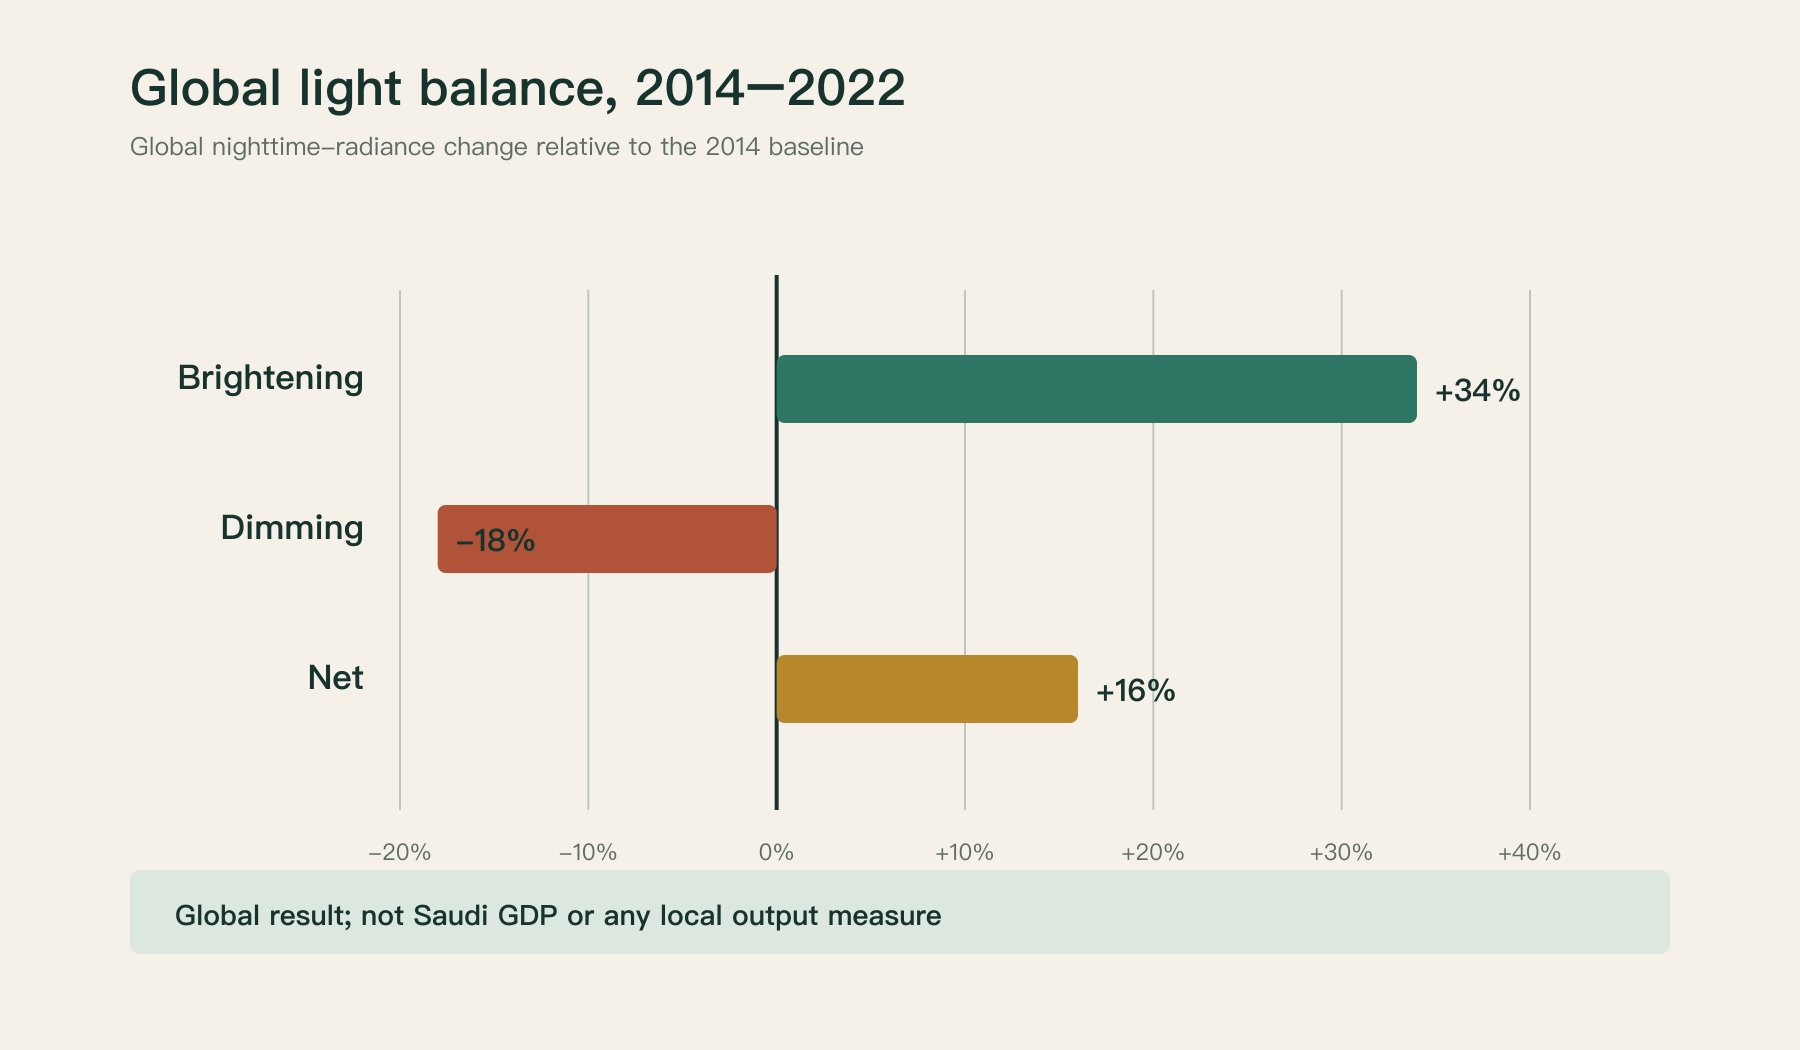
Figure 1. Components of change in global artificial light relative to the 2014 level, based on the 2026 Nature study. The percentages are not GDP growth, and the decreases do not all indicate economic contraction. Source: S08.
The reasons for the two directions matter more than the final number. In some places, light increased with urban expansion or household electrification. In others, it declined because energy efficiency improved, excessive lighting was regulated, or old lamps were replaced with light-emitting diode (LED) technology. Other places darkened because of war, crisis or a power outage. The image tells us the visual outcome of each case, not its economic or moral quality. The same colour may describe a country that improved its lighting and one whose production has broken down. We cannot decide the fate of an economy from a shared colour.
There is an additional spectral problem. The composition of light changes when lamps are replaced, and the sensor does not respond identically to every wavelength. Research on light pollution has examined the differences between what satellites record and what human observers see, including the possible role of spectral shifts in LED lighting S09. This does not mean that every satellite-observed decline is caused by lamps. It establishes that a change in lighting technology can alter the calibration of our relationship with the indicator even when the social function of the place remains the same.
5. Three Economies on One Map
Imagine three Saudi neighbourhoods to which I assign no invented names and about which I claim no measurements. In the first, a service business replaces paper processes with software that completes more work in its existing offices. Better organisation and knowledge raise value added, while neighbourhood lighting may remain unchanged. In the second, a complex opens with bright façades and expansive parking areas, causing observed light to jump before anyone knows the shops' occupancy or profitability. In the third, street lighting is replaced with a more efficient system, reducing upward light leakage while improving service at ground level.
The satellite may produce three stories at odds with these neighbourhood economies: stagnation where productivity rose, growth where viability remains unproven, and contraction where service efficiency improved. This example is entirely hypothetical, but it shows why the target must be defined before the indicator is chosen. If we want to know how far electrified settlement extends, light is useful. If we want the value added of software and services, it is incomplete. If we want the safe continuity of lighting, we may need it alongside electricity and service data, not in place of them.
The Saudi economy rearranges the problem again. Oil and gas may leave radiance from flares, but the value of oil production is not calculated from the light rising above the flame. Sectors such as telecommunications, financial technology and computing create value that can grow without installing new lamps for every work cycle. Religious tourism, social rituals and opening hours, meanwhile, shape the seasonal relationship between night and work. It is not enough to identify the location on a map; we must identify the function of light at that location.
This is not a case for abandoning satellite sensing. It is the serious reason to use it. Anyone who cannot distinguish among types of signal will gain a library of images with a fast adding machine, not economic intelligence.
6. The Economic Number That Is Not Born Whole
On 30 July 2026, GASTAT released its flash estimate for the second quarter of the year. Its website reported a 4.8% year-on-year decrease in real gross domestic product (real GDP). This was a preliminary estimate published on a specific date. It should not be treated as a number outside time or compared with another quarter without controlling for seasonal adjustment, the definition of the base and the reference year S10. The point of citing it is not to diagnose the Saudi economy. It is to illustrate a problem familiar to every statistician: an official number describes a period that has ended, appears after data collection and refinement, and may change in later revisions.
Some economists want to know July's activity before July's report reaches them. That is the task of nowcasting. It is neither a prophecy about a distant year nor an attempt to prove a statistical agency wrong. It is an estimate of a current quantity whose final data have not yet been published, with an explicit record of the information available when the estimate was made. The paradox is that satellite imagery may lead in acquisition without necessarily leading in analytical availability. Some products require processing and review. Some fill observational gaps. Some economic variables with faster release schedules may already have arrived.
I therefore propose attaching four separate dates or descriptions to every satellite estimate rather than dissolving them into a single “updated today” stamp: acquisition time, processed-data availability time, forecast issue time, and the target data vintage. If we test a model over ten years using the final revised version of every statistic and a processed image that was not available at the time, we may have conducted a retrospective reconstruction, not an honest simulation of what could then have been known.
This error is called data leakage, and it is remarkably subtle. It does not insert an obvious falsehood into the indicators. It lets information that did not yet exist enter the decision room. Every result looks elegant after the event. Even the neighbourhood fortune-teller is a genius if allowed to edit predictions after the match has ended.
7. Does the Model Gain Anything from a New Window?
There is a simple way to invalidate many inflated claims. Instead of asking, “Is light correlated with activity?” ask: Does light improve the estimate of activity relative to the conventional data already available? This is its incremental predictive value. If a model already knows aggregate sales movements, electricity consumption and some published production indicators, and adding satellite images does not reduce its out-of-sample error, we have acquired a new technical layer without gaining information useful to a decision.
The answer requires experiments that respect time. We construct a baseline model using the conventional data then available, followed by another model that sees the same data plus a lighting indicator. Each is trained on the past that was available at that moment, predicts the period whose statistics had not yet appeared, then moves to a later period and repeats the procedure. This rolling-origin evaluation reduces the temptation to train a model on our future and analyse a past rearranged after we already know its outcomes.
The models may use simple regularised regression, a dynamic factor model or a more complex probabilistic model. Complexity is no guarantee. In a short monthly series, a deep model can memorise dozens of seasons and local differences, produce beautiful predictions for data it has seen, and then struggle with time it has not. No new model can be declared intelligent until it is compared with a fair, simple baseline, the release date of every variable is fixed, and the future is kept from leaking across the training–test boundary.
8. A Small Experiment Reveals a Large Loss of Understanding
For this essay, we ran a declared research simulation. It did not use the Kingdom's economy or download actual satellite scenes. Instead, it generated 180 synthetic months with latent economic activity, a conventional economic indicator whose value arrives within the month, and a lighting indicator containing some information about activity alongside seasonal noise. We assumed that the true activity value becomes available after a two-month delay. At synthetic month 116, we changed lighting technology or policy so that the light indicator fell by four points without activity falling because of that change. The numbers, noise and random seed are published in the research file and can be rerun. This is a laboratory, not a hidden Saudi history S13.
The test began 65 months into the synthetic series and used an expanding training window that respected the target's release lag. We compared three models: the conventional indicator and past activity alone; the conventional indicator plus light; and a model told only that lighting policy or technology changed at a particular date. The last model does not know the numerical size of the effect in advance; it learns it from observations accumulated after the change. In every model, mean absolute error (MAE) was measured in synthetic activity-index points, not percentage points of Saudi GDP growth.
| Segment of the synthetic test | Conventional model | Adds light without understanding the shift | Adds light and knows a shift occurred |
|---|---|---|---|
| Before the lighting change, 51 estimates | 0.712 | 0.590 | 0.590 |
| After the lighting change, 63 estimates | 0.784 | 0.862 | 0.637 |
In the first phase, light added useful information and reduced error. In the second, the same indicator became a liability when its relationship with activity changed: the model using it naively performed worse than the conventional model. A model that recognised the lighting-regime change then recovered value from the signal. These results are entirely conditional on the synthetic assumptions and a single random seed. They do not estimate how often the phenomenon occurs in Saudi Arabia or prove that the third model will always succeed. An experiment with one hundred and fourteen synthetic estimates is not a national study of one hundred and fourteen real months.
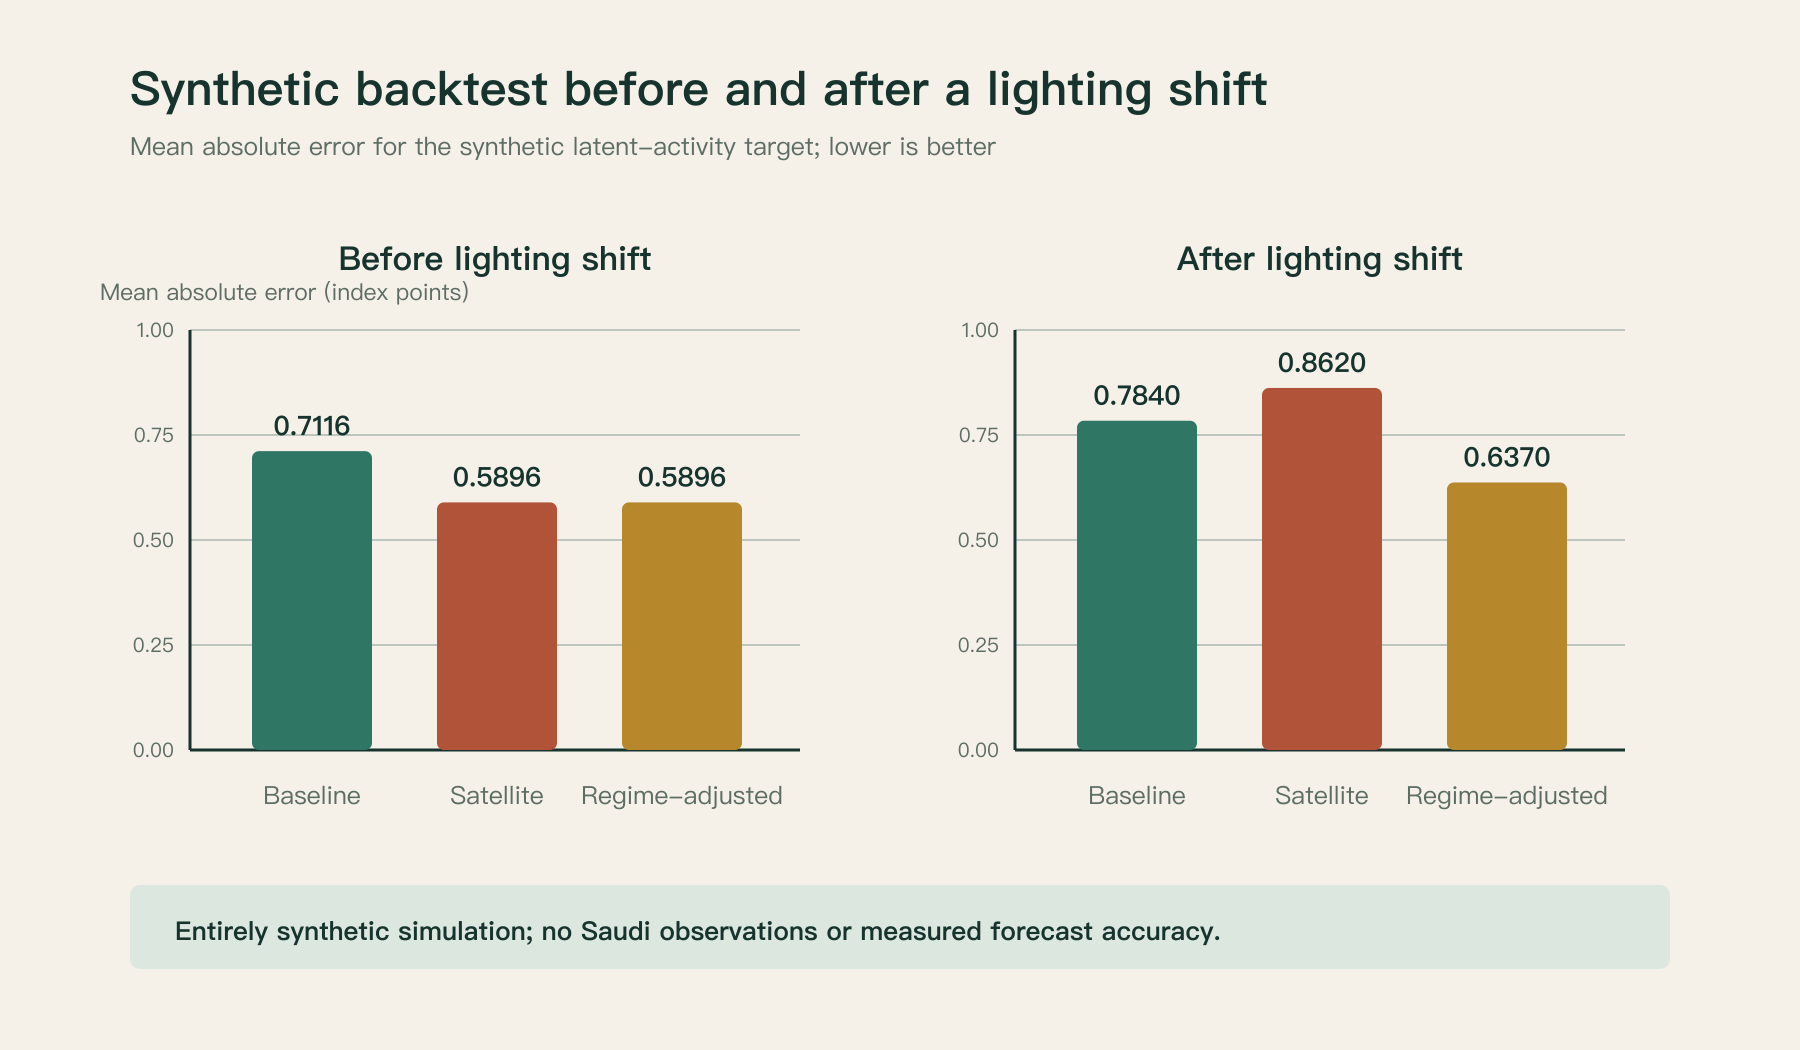
Figure 2. Mean absolute error for three models in a computer-generated simulation. The figure does not describe the Saudi economy or actual satellite data. Code, inputs and training dates are preserved in the accompanying files S13.
The more important paradox is that adding a variable may reduce average error slightly across the full series while making performance in later years worse. A national average alone can therefore hide a reversal in the indicator's validity. For an illustration of prohibited leakage, we created a synthetic version that mixed 35% of a future satellite reading into the current indicator. It did not improve in this run. The lesson is independent of the result: a forecast that violates the order of information is methodologically invalid whether it looks successful or fails. Poor performance does not absolve it of cheating, and high accuracy would not justify it.
9. When Culture Becomes a Variable in the Equation
The phrase “seasonal adjustment” conceals a deep disagreement between those who imagine months as interchangeable and those who know that a society redistributes its time. Ramadan moves through the Gregorian months according to the Hijri calendar. The Gregorian date of Hajj changes each year. Holidays and seasonal activities do not all occupy the same positions. An algorithm may learn that August is “a bright month” and then fail as Ramadan advances through the calendar. The model therefore needs time variables tied to actual seasons, not month numbers alone, while separating the effects of a season that has real economic value from its purely visual effects.
This is not a call to flood the model with holiday names. It is a call to test hypotheses. In some areas, adjusting for day length and cloudy nights may be enough; adding the social calendar may reduce error elsewhere. Light in a residential district may add less information than visitor spending. The only way to decide is through out-of-sample testing against analysis rules specified in advance.
In Saudi Arabia, this detail could become a source of local research advantage. Global data can observe radiance, but they do not always contain precise knowledge of living patterns, the functional boundaries of neighbourhoods, changes in leisure, restaurant and transport practices, or the seasons of Hajj and Umrah. Researchers who build the right variables for these mechanisms can create an original Arabic and Saudi interpretation of global data, instead of buying an image and placing the city's name on it.
10. The Temptation of Multiple Sensors: More Witnesses, No Agreement
The visible eye is not the limit of space observation. Synthetic aperture radar (SAR) in the Sentinel-1 system can detect changes at the surface at night and through clouds, subject to the limits and conditions of radar sensing S11. Other signals include aggregated vessel movements from the Automatic Identification System (AIS), images of urban activity, and indicators of the concentration of gases such as nitrogen dioxide (NO₂). But gathering witnesses does not make their accounts identical.
Radar records electromagnetic backscatter, which is affected by surface roughness, viewing angle, moisture and material composition, not by the total wages earned inside a structure. A ship's route is not the quantity of cargo it carries. A deactivated identification device does not prove that a ship has disappeared. The concentration of a gas is shaped by weather as well as by certain emissions. It is scientifically wrong to turn different physical processes into a false economic consensus by feeding every variable into one software column.
These differences can instead support qualitative intelligence. If lighting at a logistics zone remains stable while documented vessel movement falls, we can ask whether the first indicator is unable to see a particular kind of commercial slowdown. If aggregate port activity changes and documented truck movements rise, the observatory can test whether the evidence is consistent. When indicators conflict, the conflict may be a rich scientific result to understand rather than an error to bury under the phrase “multimodal fusion.”
The essential safeguard is to avoid assembling sensitive maps of critical infrastructure or linking data to identifiable facilities under the cover of economic analysis. Aggregated sector and regional levels are sufficient to build useful economic hypotheses without turning an observatory into a spatial guide to operational targets.
11. From a Telescope That Sees to a Laboratory That Can Prove Itself Wrong
This essay proposes a specific project for a Saudi observatory rather than a new institution for accumulating images. Its research name is the Satellite Signal Value Laboratory. It begins with dozens of small experiments with falsifiable outcomes, not a complete national index on its first day.
The first experiment asks about an aggregate measure of non-oil activity in selected regions for which official aggregate data are available. Researchers combine monthly light measurements with observation-quality layers, documented lighting-replacement events where available, the social calendar, and conventional economic indicators in their correct historical vintages. They announce the issue date of the estimate and compare the error of the augmented model with that of a simple economic baseline. They repeat the test across different years and seasons. If the indicator fails to improve performance, that is a useful result showing where investment in new imagery is unwarranted.
The second experiment examines trade and logistics activity at the level of ports or regions, using aggregate maritime indicators and suitable imagery. The goal is not to identify an individual vessel, but to ask whether adding remote sensing improves detection of changing flows relative to published trade indicators. A third experiment compares different kinds of economic region: service areas that produce almost invisible value, industrial areas more closely related to material energy consumption, and areas shaped by religious or tourist seasons. If predictive strength differs among these classes, adapting the model to the function of place may be more valuable than training an enormous national model that consumes everything.
What exactly should we monitor? Not a “98% accuracy” line dispatched in a press release. We want the reduction in forecast error on future tests, the stability of that reduction after lighting technology changes, the number of days by which the image became available before the economic number, the share of nights with good observations, differences across regions, and an uncertainty interval whose actual coverage has been evaluated. Errors must be disclosed as fully as successes.
12. The Strategic Value of Information That Admits Its Limits
An entire economy could be built around this problem, but it would not resemble the satellite-imagery industry alone. Its products would include tools for maintaining a point-in-time data store, provenance-aware image processing, time-series backtesting engines that operate on separate future periods, detection of breaks in the relationship between an indicator and the quantity we want to measure, and economic integration that states where knowledge ends.
Companies might emerge from these tools to export services to countries where regional data are weak or slow to appear. Their success should not be measured by the number of images processed or countries coloured on an interactive map. It should be measured by whether they improve a specific decision before the date on which its maker would otherwise learn the truth. If they add no predictive value in a data-rich economy, their more useful market may lie in monitoring urban growth, detecting outages, or observing spatial changes in activity where detailed statistics do not exist. These are different research markets and should not be folded into one claim.
Saudi Arabia can treat public space data as raw material for an exportable national analytical method. Such an industry needs experts in optics, data, economics and artificial intelligence who know where physics begins and the economic argument ends. It also needs local experts who can explain why city life shifts from day to night during one period, why satellites see less light after a better-lighting project, and why some value leaves no clear thermal or photonic trace.
What is truly impressive about this prospect is not the promise that it will let us “see everything.” That is an old illusion wearing new device names. The exciting part is learning what the image does not mean, then designing an experiment that reveals the meaning it can actually carry. Scientific progress does not begin with the first chart that dazzles a minister or investor. It begins with the first result that tells them honestly: this signal did not help us; or it helped here but not there; or it helped before the lamps changed and then stopped.
13. The Economy a Streetlight Cannot Capture
If we cast a half-kilometre grid over Riyadh from space, we will obtain millions of possible relationships among surface, light and time. Not one contains a ready-made definition of productivity, an inventory of unpaid labour, the value of software designed in a small flat, or the difference between a port crowded with cargo and one crowded with lights. Yet the grid contains real physical observations that no institution can invent in a press release, and it therefore deserves to be taken seriously.
Perhaps the most naive line in the space economy is, “The satellite does not lie.” A satellite has no duty of truth in the sense we want. It is not offering economic testimony in the first place. Photons pass through lenses, calibrations and correction algorithms, and a human then places them in a model with a chosen target and assumptions. The observation may be correct while answering the wrong question.
When 2030 arrives and the Kingdom has wider layers of sensing and analysis, the real leadership question will not be how many cities can appear illuminated on a screen. It will be: In which kinds of decision did these signals let us know something true sooner, and what evidence shows that we would have been wrong without them?
That is the distance between owning an eye in orbit and building a research mind on Earth.
Article Sources and Inspectable Materials
- NASA, The Lights of Ramadan and Eid al-Fitr, 2015. https://science.nasa.gov/earth/earth-observatory/the-lights-of-ramadan-and-eid-al-fitr-84923/
- Miguel O. Román and Eleanor C. Stokes, Holidays in Lights: Tracking Cultural Patterns in Demand for Energy Services, Earth's Future 3 (2015), 182–205. https://doi.org/10.1002/2014EF000285
- Saudi Press Agency, GASTAT: Total Number of Pilgrims for Hajj 2026 Reaches 1,707,301, 2026. https://www.spa.gov.sa/en/N2599493
- J. Vernon Henderson, Adam Storeygard and David N. Weil, Measuring Economic Growth from Outer Space, American Economic Review 102(2), 2012, 994–1028. https://doi.org/10.1257/aer.102.2.994
- World Bank, Measuring Quarterly Economic Growth from Outer Space, 2022. https://documents1.worldbank.org/curated/en/692011641480491613/pdf/Measuring-Quarterly-Economic-Growth-from-Outer-Space.pdf
- NASA Goddard Space Flight Center, Black Marble Product Description. https://viirsland.gsfc.nasa.gov/Products/NASA/BlackMarble.html
- NASA, Black Marble User Guide, Collection 2.0, 2024, sections on temporal gap-filling and product quality flags. https://viirsland.gsfc.nasa.gov/PDF/BlackMarbleUserGuide_Collection2.0.pdf
- Tian Li et al., Satellite Imagery Reveals Increasing Volatility in Human Night-time Activity, Nature 652 (2026), 379–386. https://doi.org/10.1038/s41586-026-10260-w
- Salvador Bará and José J. Castro-Torres, Diverging Evolution of Light Pollution Indicators, author manuscript, 2024. https://arxiv.org/abs/2409.13111
- General Authority for Statistics, GDP: Flash Estimate Q2/2026, published 30 July 2026. https://www.stats.gov.sa/en/search-publication?category=publication&delta=4&q=الناتج+المحلي+الإجمالي
- Synthetic Vintage-Aware Backtest, version 1.0. See
analysis/reproduce.py,data/backtest_metrics.csvand independent companion. - European Space Agency, Sentinel-1 Mission. https://www.esa.int/Applications/Observing_the_Earth/Copernicus/Sentinel-1
Production statement: This investigative research essay was prepared from published sources and documented synthetic analysis. It does not claim to measure Saudi growth directly from satellites or use private institutional data, and it has not undergone independent scientific peer review.