Working Paper 1.0: a conceptual framework and executed synthetic experiment. No original Saudi operational measurements; not peer-reviewed.
Keywords digital prosperity paradox · service continuity · cloud infrastructure · common-cause failure · cyber resilience · Saudi Arabia · Gulf · synthetic simulation
In this article
The Digital Prosperity Paradox: A Service-Coverage Framework and an Executed Synthetic Dependency Experiment
MERIDIAN FUTURES LAB | M01 Scientific Companion | Working Paper 1.0 | 25 October 2026
Type of work: Conceptual working paper with an executed, reproducible synthetic computational experiment.
Status: A bounded review of original evidence, a synthetic operational model with actual computed results, and a proposed data and validation protocol. The paper contains no original Saudi operational measurements and has not undergone peer review.
Information cutoff: 25 October 2026. Policy and testing horizon: 2026–2035.
Abstract
This paper examines a question with two possible answers: does digital integration make the state more efficient and better able to continue through crises, or does concentrating functions in shared dependencies increase the effect of some shocks? The answer cannot be inferred from internet penetration or the size of a technology market alone; those measures describe properties different from the amount of essential service completed when computing, communications, suppliers, and maintenance layers face simultaneous pressure. We critically review models of cascading failure and redundant interdependencies, literature on resilient engineering, and real-world examples: strikes that damaged cloud regions in the Gulf in 2026, operational delay following a widespread software outage in 2024, and emergency calls that failed to reach their destination in 2023.
We propose a bounded service-level measure of valid demand coverage within a defined time window, with separate indicators for backlog, recovery time, and cost. We then execute a synthetic experiment of 40,000 windows for each of nine sets of assumptions, comparing three abstract architectures: one shared path, two alternative paths, and two paths with limited degraded-mode capability. In one hypothetical condition, where the probability of a common shock is 20% within 48 hours and the second path remains independent of the first, mean demand coverage was 88.40%, 92.44%, and 93.31%, respectively. When we assumed that both paths shared the same event while retaining the additional capacity burden, the corresponding results were 88.37%, 87.04%, and 88.81%. These values were produced by running the accompanying code under wholly assumed inputs; they neither measure nor predict the performance of Saudi services.
The conceptual result is that the direction of the trade-off depends on the form of dependency and the actual covariance of failure causes, the validity and cost of the alternative, and when the user needs the service. The paper proposes a validation protocol using aggregate measurements from authorised recovery exercises and comparative designs that account for differences in institutional quality, funding, and service complexity. Its contribution is a clear tool for identifying what must be measured and what would change a decision, not a safety report on any particular infrastructure.
Keywords: digital-state resilience; cascading failure; common-cause dependency; service continuity; synthetic simulation; recoverability; compound shocks.
English abstract
This conceptual working paper examines a conditional proposition: digital integration may raise routine service efficiency while increasing exposure to failures shared across dependent functions; alternatively, integration may strengthen monitoring, redundancy and recovery. The paper distinguishes access, experience, cybersecurity market size, and operational service continuity. It critically reads foundational work on cascading failures alongside evidence that redundant interdependencies can improve robustness. Three real-world evidence clusters inform the mechanism without serving as measurements of Saudi performance: wartime physical damage to Amazon Web Services infrastructure in the Gulf in 2026, a software-update outage with post-restoration backlogs in 2024, and an Australian telecommunications outage affecting emergency calls in 2023.
We propose a bounded valid-demand-coverage measure and separately track backlog, recovery duration, cost and unequal exposure. An executed, fully synthetic Monte Carlo experiment compares a shared single path, two paths, and two paths with limited safe fallback. Nine illustrative parameter combinations each use 40,000 paired trial windows of 48 hours. Under one assumed common-shock probability of 0.20 and independent path failures, mean valid-demand coverage is 88.40%, 92.44%, and 93.31% respectively. When two paths are forced to share an outage event, the respective results are 88.37%, 87.04%, and 88.81%. These outcomes are conditional outputs of an invented model, not empirical Saudi estimates or operational forecasts. A validation protocol specifies authorised aggregate data, rival hypotheses, causal identification requirements, uncertainty and decision thresholds.
Keywords: digital public infrastructure; interdependent networks; common-cause failure; resilience; service-coverage measurement; stochastic simulation; Saudi Arabia.
1. Research Question and the Problem of Inference
The principal question is: How does expanding digital integration change the amount of essential demand that services can continue to meet correctly and safely during simultaneous shocks, once dependency structure, alternatives, institutional capacity, and cost have been taken into account?
Five subsidiary questions follow:
- Under what conditions does integration lower the cost of routine service or improve quality, and when must that outcome be separated from service resilience?
- What share of degradation results from components operating independently, and what share results from one event reaching shared components?
- When are backup paths independent functional alternatives, and when are they merely duplicated systems affected by the same event?
- Can a useful and safe portion of a service continue when full processing or connectivity is unavailable, and what effect does this have on backlog and later reconciliation?
- How should the cost of alternatives be compared with expected loss and the social value of continuity, without pricing people's basic rights as if they were ordinary commercial transactions?
The question combines three objectives: a descriptive objective that measures the degradation that occurred; a causal objective that estimates the effect of one architecture on service performance compared with a feasible alternative; and a decision objective that asks which design warrants its cost and constraints. Succeeding at the first does not prove the next two. Services in a wealthier, more experienced country may improve for many reasons while its architecture also becomes more integrated. A simple statistical association between the number of platforms and recovery is therefore insufficient.
Rival hypotheses
- H1 — Integration gain: Given equal funding, management quality, and demand type, integration improves routine performance and may improve recovery through unified monitoring and concentrated expertise.
- H2 — Shared exposure: When several functions share one critical operating condition, the potential scope of degradation grows under a shock that affects that condition.
- H3 — Effect of a real alternative: If an alternative mechanism is sufficiently independent and can operate safely, service loss may fall as multiple dependencies are introduced.
- H4 — Limits of a nominal alternative: If the alternative and the original share a single causal failure, the cost of redundancy may consume its benefit.
- H5 — Backlog is part of performance: Restoring technical connectivity may precede the completion of rights, transactions, and requests delayed by the outage. Repair time and social recovery time may therefore differ.
H1 and H3 allow the argument to end with an advantage for integration in measurable cases. H2 and H4 identify conditional harm; H5 prevents success from being measured at the system interface alone. We do not claim that these hypotheses were preregistered with an external body.
2. The Paper's Place in the Literature
2.1 From component strength to the strength of a combined network
In 2010, Sergey Buldyrev and colleagues presented a mathematical model showing that interdependency among particular types of network can repeatedly transfer node loss across layers, allowing its effect to exceed the initial small shock. The paper helps explain why testing the robustness of each layer alone is insufficient. S11 It uses specific network assumptions, however, and directly transferring its numerical results to an economy or a state would be an error of external validity.
That idea is balanced by a 2017 study by Filippo Radicchi and Ginestra Bianconi, which constructs a different mechanism: in some multiplex networks, redundant interdependencies can increase rather than reduce robustness. S12 Research must therefore specify the logic by which components are required: AND when all must work, OR when any one alternative is sufficient, or a more complex rule tied to service quality and safety. These are not linguistic distinctions; they change the set of states in which the service succeeds.
From a systems-engineering perspective, the National Institute of Standards and Technology (NIST) Special Publication 800-160, Volume 2, Revision 1 provides a reference point for thinking about anticipating adverse conditions, withstanding them, recovering from them, and adapting afterward. S13 The framework addresses the ability of systems to perform their functions across a lifecycle, while our study translates some of those concerns into quantitative service-level indicators.
2.2 The intellectual history of complexity and interconnection
In Normal Accidents, Charles Perrow offers an institutional perspective that distinguishes interactions that are difficult to predict from coupling that leaves little time for intervention. This is useful when examining tightly connected digital services. S14 In The Architecture of Complexity, Herbert A. Simon supplies a foundation for thinking about near-decomposability: an organisation that permits some functional independence within a larger system. S15 We use both authors' ideas as interpretive tools without converting their historical examples into empirical evidence about the present-day Gulf.
2.3 Where is the gap?
The theoretical papers demonstrate possible and competing mechanisms; incident reports document particular practical outcomes. The missing link is measured data connecting the degree of integration and form of dependency to the amount of valid demand completed after a shared disruption. Beneficiary-satisfaction averages or counts of data centres cannot fill that gap. This paper therefore combines a bounded review, a reproducible experiment, and a plan for authorised field validation.
We did not conduct a comprehensive systematic review of all relevant literature. Papers were selected to establish mechanisms, include a competing perspective, and draw on original engineering references. We do not claim to have searched every database or extracted an empirical effect size suitable for meta-analysis. The stopping criterion was enough evidence to clarify rival hypotheses and their limits, not qualification for the label “systematic review.”
3. Incident Evidence and the Limits of Transfer
| Original incident | Source-supported observation | What does it contribute to this paper? | What does it not establish? |
|---|---|---|---|
| Strikes on Amazon Web Services (AWS) facilities in the Gulf in March 2026, followed by a September recovery update | Physical damage to two facilities in the United Arab Emirates and effects from a nearby strike in Bahrain; in September, resources hosted exclusively in specified areas remained inaccessible. S05S07 | A test of the limits of spatial separation and data recovery under a simultaneous physical shock, and evidence that customers who migrated operations could successfully resume them. S06 | That a Saudi facility was hit, that all customers lost their data, or that weakness in local infrastructure was established. |
| Faulty CrowdStrike software update, July 2024 | The company acknowledged a defect, and a local NHS organisation reported that a backlog remained after its system returned. S08S09 | The need to distinguish technical availability from backlog clearance and the time required to complete service. | The scale of effects across all health facilities or the causal outcome of every contingency measure. |
| Optus outage in Australia, November 2023 | The regulator found that 2,145 users could not access the emergency service and that 369 required welfare checks were not completed. S10 | The need to weight service quality and timing, particularly where value depends on urgent access. | Deaths, specified individual losses, or generalisation of the probability to another country. |
Causal note: Reuters' March 2026 report said that a regional bank announced disruption to its applications and services during the same period, but it did not attribute the bank's disruption directly to the Amazon Web Services incident. S05 The paper therefore does not use temporal coincidence alone to establish that the impact passed from those facilities to a named bank.
Official Saudi data report internet penetration of 99.6% in 2025 in a report published in 2026, digital-experience maturity of 86.71% across 50 platforms in 2025, and a cybersecurity market worth SAR 16.3 billion in 2025 in an October 2026 publication. S01S02S03 We do not combine these quantities into a composite continuity index: they differ in subject, unit, source, and denominator. Their role is to establish the scale of activity and the subject we want to test, not the result of the test.
4. The Proposed Measure: Useful Service Within a Defined Window
Let there be a service , a scenario , and a period . Define as the justified reference demand for an essential service at time , and as the output actually completed while satisfying requirements of safety, quality, availability, and timing over the same period. We then define:
Four conditions are necessary for this expression to be interpretable: , , agreement between the numerator's and denominator's units, and positive total demand in the denominator. The min operation ensures when those assumptions hold. If reference demand is zero, the case is recorded as not applicable rather than dividing by zero or silently changing the denominator.
To aggregate across services, one may propose with non-negative weights that sum to one. Doing so requires a social and institutional justification for the weights, separate reporting for each service, and review of the effects of regional demand patterns or differences among beneficiary groups. The average may remain high while a lightly weighted but high-risk service fails. When compatible weights cannot be constructed, a disaggregated dashboard is more honest.
Why do we need reference demand?
Recorded demand sometimes falls because users cannot submit it at all and systems stop accepting work. If recorded demand during an outage were the only denominator, the ratio might improve while beneficiaries wait outside the system. A defensible baseline is therefore needed, based on usage history, seasons, service type, and human behaviour during the crisis, together with an estimate of how sensitive the result is to changes in that baseline.
Why is this measure insufficient on its own?
It does not necessarily count work deferred beyond the observation window, irreversible harm, reconciliation errors, unobserved transaction quality, or operating costs. We propose reporting alongside it: the most severe deficit sustained for a defined duration; time to reach and remain at the required service threshold for a specified period; backlog size and disposal method; the status of inaccessible data; a separately estimated economic cost; and aggregate differences across locations or services. Cases that have not recovered by the end of the observation period should be marked as right-censored, not as having “recovered on the final day.”
5. The Executed Computational Experiment
5.1 Purpose and scope
The experiment has a narrow scientific purpose: to test the sensitivity of coverage outcomes to the architecture of alternatives and their failure dependencies. It does not simulate an actual network, estimate the frequency of airstrikes or component failures in the Gulf, or test the response plan of a real institution. Every case is hypothetical, and every output is a model result conditional on the stated assumptions.
We created five abstract service categories with no institutional names and demand weights , which sum to one. One demand unit for each service is one hypothetical unit per hour over hours. Demand weights and intensity do not change during a crisis, a material simplification that prevents the study from claiming to represent real user behaviour. Each window contains possible outage events beginning partway through the period, plus separate independent local events for individual services. Architectures are compared under common events generated once within each assumption set, a paired comparison that reduces the variance of differences between designs.
5.2 The three architectures
A — Single Shared Path. The service depends on one primary component, the absence of a common shock, and the health of its local component. If any condition fails, valid output for that hour is zero; otherwise it is one full unit.
B — Two Paths. One of the two primary paths is sufficient, provided no common shock occurs and the local service remains healthy. We set normal capacity to 0.985 units for each healthy hour, representing a hypothetical 1.5% reduction in operational capacity to support this design. We do not treat this reduction as an estimated financial cost or a universal penalty for distribution; it is a synthetic coefficient to vary in later models.
C — Two Paths with Bounded Fallback. This architecture resembles B when the common infrastructure is available and adds a hypothetical controlled capability during its outage for some service classes: . We assume these shares can deliver a safe and valid service without demonstrating that claim for any real service. The zeros for the last two classes acknowledge that some work should not be conducted in a degraded mode or without the required verification. The model does not count reconciliation errors or delayed storage, limitations that affect real feasibility.
To represent the logic algebraically, let be a common-shock event that disables the primary system, a failure of the first path, a failure of the alternative, and the health of service 's local component. Each failure event has value one during an outage hour and zero otherwise; has the inverse meaning. We use multiplication of logical masks for simplicity. Abstract valid output is then:
This formulation distinguishes the simultaneous necessity of healthy conditions for an individual service from substitution across two paths. It also separates assumed “valid service” from mere network connectivity.
5.3 Shock events and randomness
| Parameter | Synthetic values used | Interpretation and limits |
|---|---|---|
| Window length | 48 hours | Standard comparison period, not an actual recovery duration. |
| Number of trials | 40,000 windows for each of nine sets | 360,000 generated windows; each design is compared within its set, yielding 27 design-result groups. |
| Probability of a primary-path failure during the window | 0.38 | Experimental assumption; it does not represent the failure frequency of cloud services or institutions. |
| Probability of a local fault for each service | 0.10 | Local events are drawn independently for each category. |
| Probability of a common shock | 0, 0.20, 0.50 | Three sensitivity conditions, not forecasts for the next 48 hours. |
| Sharing of the two paths' failure event | 0, 0.50, 1.00 | A mixture of independent and identical events; these values are not Pearson correlation coefficients. |
| First-path event duration | 4 or 12 hours | Selected randomly within each realised event. |
| Common-shock duration | 6 or 18 hours | Applies to the primary infrastructure of both paths. |
| Local service-event duration | 2 or 6 hours | Affects one service even if the shared paths remain available. |
| Normal capacity of B and C | 98.5% | Assumed synthetic capacity cost; it excludes money, energy, and maintenance. |
| Degraded-mode capacity for some services | 30%, 25%, 10%, 0%, 0% | Values conditional on safety that cannot be guaranteed before testing a real service. |
Each event window is drawn from starting hours that allow the component's longest specified duration to fit within the observation window. Short events may therefore be weighted toward earlier starting times. This is a disclosed scenario feature, not a description of the temporal distribution of real failures. At failure-sharing level 1, the alternative copies the original's outage window. At zero, the alternative receives an independent event with the same marginal values. At the intermediate level, the code chooses between copying and independence using the specified mixture.
We used NumPy's random-number generator with a root seed of 20261025 and disclosed derivatives for each set. The code that created the outputs is in analysis/reproduce.py; it writes the full results table to data/simulation_results.csv and the assumptions to data/assumptions.json. The code was actually run to produce the accompanying tables and figures. Running it again reproduces the same values under the documented environment and software version.
5.4 Outputs and statistics
For each experimental window, we calculate time-mean weighted demand coverage, then average that result across the 40,000 windows. We also calculate the share of windows that failed to achieve 90% coverage and the share of trial hours in which the weighted total fell below 50%. These two thresholds were chosen as presentation tests within the model; they have not undergone institutional approval or calibration as safety thresholds for real services.
We report the Monte Carlo standard error alongside the mean. It is the standard deviation across window outcomes divided by the square root of their number. It describes fluctuation in the numerical estimate due to simulation size; it does not measure uncertainty about real probabilities, errors in the choice of weights, or the generality of the model. Error bars in the computational figure must therefore not be described as “confidence intervals for Saudi resilience.”
6. Executed Results and Their Interpretation
6.1 Coverage as shock and dependency change
| Common-shock probability per window | Path-failure mixture | A: one path | B: two paths | C: two paths + limited continuity |
|---|---|---|---|---|
| 0% | 0.0 | 92.93% | 97.24% | 97.31% |
| 0% | 0.5 | 92.88% | 94.32% | 94.88% |
| 0% | 1.0 | 92.96% | 91.56% | 92.58% |
| 20% | 0.0 | 88.40% | 92.44% | 93.31% |
| 20% | 0.5 | 88.24% | 89.61% | 90.95% |
| 20% | 1.0 | 88.37% | 87.04% | 88.81% |
| 50% | 0.0 | 81.40% | 85.04% | 87.14% |
| 50% | 0.5 | 81.44% | 82.67% | 85.17% |
| 50% | 1.0 | 81.40% | 80.18% | 83.09% |
Table 3 — Actual output from a synthetic model. Each cell is the mean of 40,000 windows, not a measurement of a sector or country. Small differences among some A rows result from independent random draws across condition sets.
The first conditional finding is that the independence of failure causes matters more than the number of paths alone. With an assumed common-shock probability of 20% and no sharing of failure events between paths, B exceeded A by about 4.04 percentage points. When we forced both paths to share the same failure event, the ordering of A and B reversed by about 1.33 percentage points in A's favour. Within this model, the reason is B's assumed capacity burden without the compensating benefit of actual independence. This is not a real-world law that redundancy “causes harm”; it is a result of the selected parameters and failure rule.
The second conditional finding is that degraded mode added coverage in every displayed case because it adds a positive assumption absent from the other two architectures: valid service capacity during a path outage. This result is built into the mathematical structure. Turning it into a recommendation would require proof that the capacity is real, safe, and acceptable to users and regulators, and that its cost and reconciliation obligations do not make it worse than orderly deferral.
Third, adding paths alone cannot remove the effect of a common shock that disables them together. Under the assumed 50% condition, B's coverage remained below 86% even when the two paths' individual events were independent. The scale of that deficit depends on the hypothetical shock duration. Changing the durations would change the result, a further sensitivity test not performed in this edition.
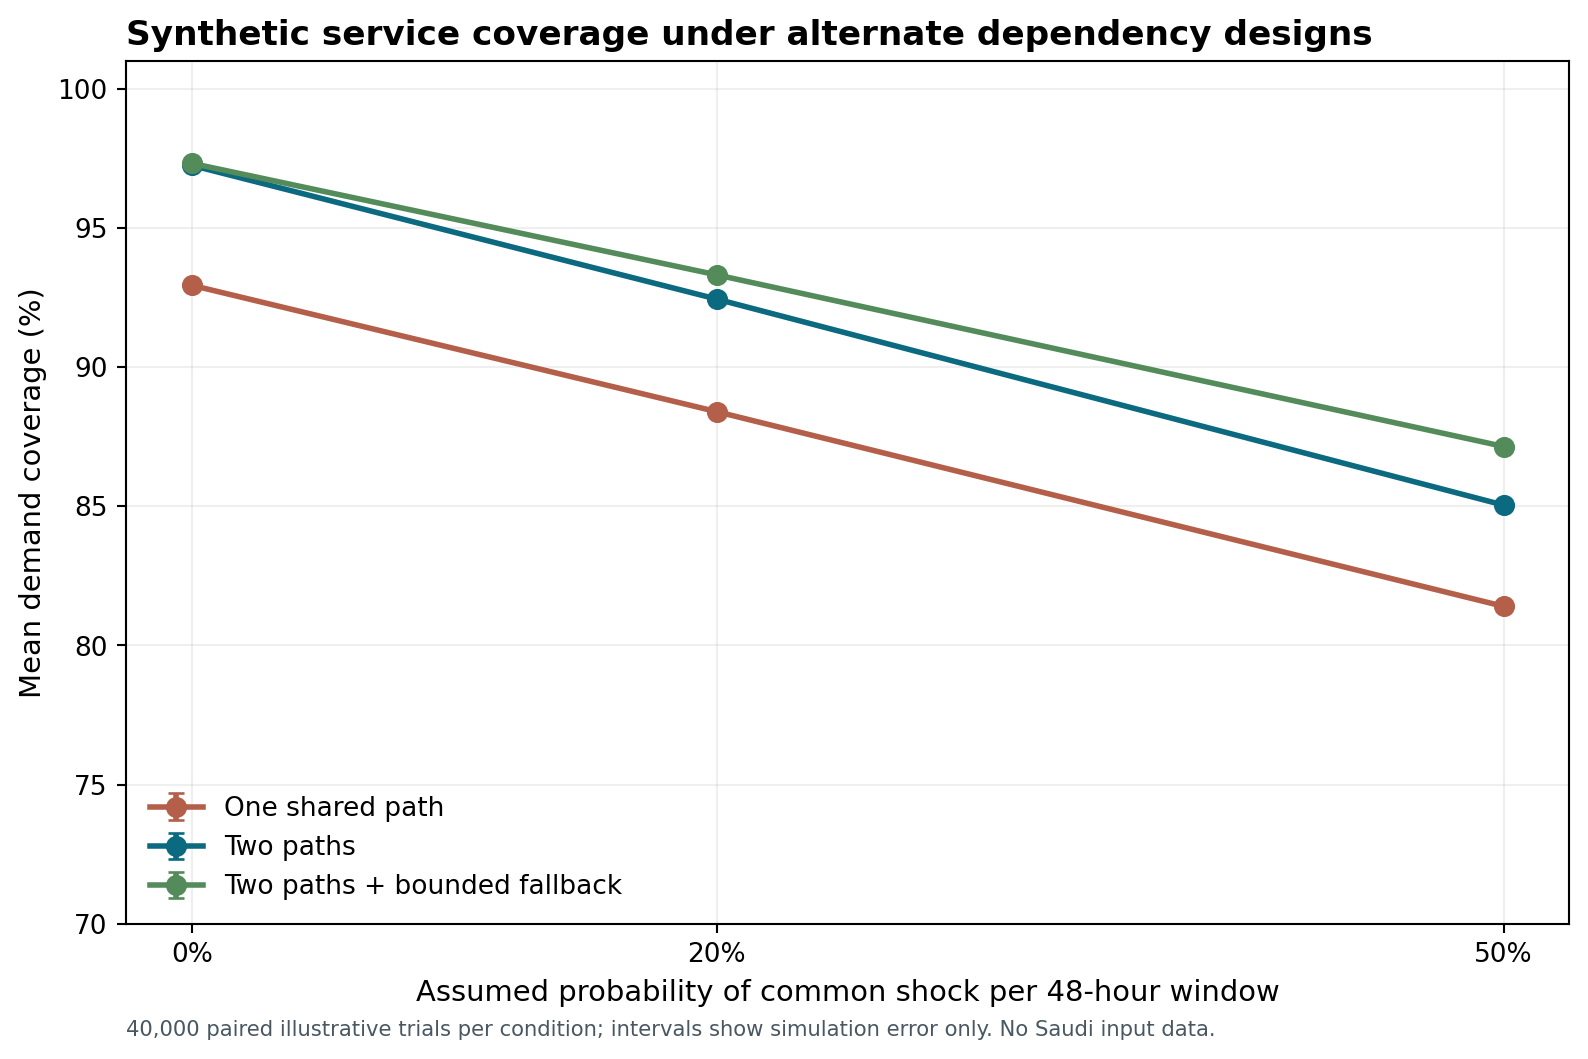
Figure 1 in the research paper — Synthetic mean percentages in the scenario where the two paths do not share their individual failure events. Source: execution of this study's code only.
6.2 Tail measure: windows that fall below 90%
With a 20% common-shock condition and independent paths, the share of windows whose mean coverage fell below 90% was about 37.7% for A, 21.5% for B, and 21.2% for C. When both paths were forced to share the same failure event, the corresponding shares became 37.7%, 41.0%, and 37.8%. This asks a different question from mean coverage: averages may be close while the number of poor periods differs substantially. It remains a synthetic calculation dependent on the chosen 90% threshold.
The experiment does not measure whether a transaction was lost at the end of the period or compensated for later. It does not represent unmet-demand backlog, the priority of real cases, or the distribution of harm across households and regions, because the model received none of those variables. The label “simulation study” therefore cannot be stretched into a claim that the experiment simulates an entire economic and social reality.
6.3 Where can the conclusion reverse?
- If the normal-conditions cost of B's lost capacity rises, the threshold at which independence's expected benefit exceeds its cost will change. We have not yet tested a wide range of those costs.
- If alternative failure modes are more correlated than assumed, the benefit of redundancy falls; if technologies and suppliers are truly independent, it may rise.
- If degraded mode fails to verify beneficiary identity or data integrity, its valid share may fall to zero, or its operation may be unacceptable despite its technical capacity.
- If demand rises during an incident, or if a backlog persists after resources return, demand coverage and later operational outcomes may change in ways the current model does not capture.
- If integration helps detect the failure or move the service more quickly, actual failure duration will fall and resilience may improve despite shared dependencies. The model does not estimate this institutional advantage directly.
7. How Could the Hypothesis Be Tested in Real Saudi Services?
An applied study must begin from a modest premise: we do not have authorised operational records here with which to measure the continuity of specified Saudi services during a war or recovery exercise. Public digital-performance indicators do not provide detailed time series for valid demand, outage, backlog, and alternatives. What follows is therefore a proposed protocol, not a description of collected data or completed experiments.
7.1 Unit of analysis and sample
The best initial unit is an essential service during a defined time window and specified disruption, with the possibility of comparing aggregate locations or institutional groups without exposing the characteristics of sensitive facilities. Services would be selected according to timing, safety, and availability requirements and subject to approval for access to aggregate data. Before choosing a final number of services or observation period, researchers would need to assess whether sufficient records exist and how categories can be defined fairly. A sample size must not be invented merely because it sounds scientific.
Digital dependencies can be described in five categories that do not disclose details of vulnerabilities: computing provider; connectivity; identity and authorisation; settlement or integration component; and human or operational capability. The purpose is to identify whether functions depend on one supplier category, recovery mechanism, or regulatory key without publishing operational paths, addresses, or targeting details. Duration-of-degradation data must complement this account; an asset inventory alone is insufficient.
7.2 Minimum variable matrix
| Proposed variable | Operational definition to agree in advance | How to protect validity |
|---|---|---|
| Service type | Functional category with a defined sensitivity level and tolerance period | Do not combine an urgent service with one that can be deferred without comparable harm. |
| Reference demand volume | Expected demand justified by historical data or a model with stated uncertainty | Report demand periods, seasons, and cases whose requests never reached the system. |
| Valid output | Requests completed safely, correctly, on time, and under a stable definition of success | Audit a sample of completion data and distinguish receipt from completion. |
| Common dependency | Aggregate categories of dependencies and suppliers | Prevent disclosure of a point or institution from which targetability could be inferred. |
| Alternative independence | Result of an authorised practical migration exercise and the time required to move service | Verify that copies, keys, and procedures work, rather than merely exist. |
| Backlog | Requests not completed within the defined time or requiring later reconciliation | Record request age, errors, and returns, not only request count. |
| Cost | Lifecycle cost of continuity capability and expenses of the test event | Separate fixed, event-specific, and unrealised-loss costs. |
| Institutional context | Resources, user characteristics, management maturity, and service complexity | Include these factors when interpreting differences before attributing them to integration. |
In a pilot study, could be calculated at service level and accompanied by a time series for accumulated requests and the result of a defined alternative-path exercise. The report should state whether the data came from an experiment, an internal test, or an observed incident. These sources should not be collapsed into one average merely because a comprehensive spreadsheet exists.
7.3 Defining the causal comparison
Suppose the proposed decision is to move from operating architecture A to architecture B. The actual causal question concerns the difference in service outcome if the service operated under comparable conditions with each. Both potential outcomes for the same service under the same shock cannot be observed at the same time, so an inferential design is required.
If defensive exercises are authorised and safe, architectures or recovery scenarios can be compared under common demand rules and clear measures. The design should prevent the test team's growing experience from making the last architecture look better merely because it was tested after more training. Staggered-adoption designs or repeated comparisons may help when differences across groups and time are understood, but researchers must examine prior trends, concurrent events, and spillovers across institutions or suppliers.
A weak alternative would be to collect “integration” and “resilience” scores in one survey, then infer causality from a high correlation. An institution with a larger budget and stronger expert team may receive high scores on both. These are confounders that must be characterised, though some may be difficult to control statistically. Sometimes the conditions for causal identification will not exist; disciplined comparative description is then more truthful.
7.4 A criterion that could change the paper's conclusion
The shared-exposure thesis would be weakened for the category under study if repeated independent exercises in an integrated service showed higher valid demand coverage, shorter recovery time, and lower backlog across diverse shocks after accounting for supplier alternatives, funding, and management maturity. It would be strengthened if simultaneous functional degradation could be attributed to a documented shared dependency and independent alternatives were then shown experimentally to reduce that loss without introducing consequential new errors. In either direction, costs, benefits, and constraints should be interpreted, and the persistence of the effect in other service categories tested.
8. From the Measure to an Economic and Social Decision
An institution may pay repeatedly for reserve capacity it does not need on most days. Judged only against an average normal day, that payment appears wasteful. It may become a rational option when an outage costs more than repairing a computer: waiting for medicine, inability to prove a transaction, delayed factory output, or the risk that an urgent call will not connect. Such harms should not be merged into a single monetary figure without an ethical and methodological basis, but they should not be erased from the calculation merely because they are difficult to price.
A conceptual economic comparison can be written as:
This is not a numerical estimate of the Saudi economy, and it does not imply that every human benefit can be priced. Each term requires a definition and sources, while the same loss must not be counted twice as it moves between supplier and customer. The decision changes with the severity and duration of shocks, insurance compensation, regulatory compliance, and the presence of usable external alternatives. It may justify a modest continuity option for one service, a large investment for another, and orderly deferral for a third.
From the perspective of computational economics, normal-condition operating savings should be compared with the additional severity, speed, and cost of degradation that common dependency may create. If services can switch paths or restore transactions before their window of harm closes, independence becomes more valuable. If repeated spending on reserve facilities displaces more useful resources without a measurable improvement, added complexity may be unjustified. Real data are needed to give this relationship numerical values.
The problem also has a distributive dimension. A high service rate for the majority does not guarantee access for someone who cannot use an alternative channel, or for a small business whose budget cannot buy a second cloud copy. The paper therefore proposes separating the mean, severe shortfall, and equity of access when evaluating continuity. Any choice of weights or thresholds should be published together with the effect of changing it, so a single indicator does not conceal an affected group.
9. Conditional Scenarios to 2035
These scenarios are not forecasts with estimated probabilities. They are ways to define the decisions and indicators that should change with new evidence.
- Improving the reliability of integration: Institutions measure service across the user journey, test migration to independent alternatives, and manage backlog. Observable test: a shorter period of degraded performance, at a proportionate cost and with more valid demand coverage.
- Concentrating dependencies: User, transaction, and equipment counts grow, but actual migration continues to depend on a small number of similar mechanisms. Observable test: repeated migration failures across different exercises, or data remaining exclusively within boundaries that are difficult to cross during a wide shock.
- Institutional learning and a specialised industry: Skills in functional monitoring, recovery, and degraded-mode operation become testable products sold to many institutions. Observable test: actual sales and documented performance among independent customers, with the benefit measured again.
These scenarios should be updated only when documented data change or a new test occurs. A news report about a possible military threat changes which scenarios deserve examination, but does not record an event as having occurred or assign a precise probability to its timing. Forecast calibration requires a record of predictions issued before outcomes and clear resolution rules; that lies outside the work completed in this paper.
10. Research Limitations and Plausibility Assessment
Information limits: Public pages from government institutions provide indicators of penetration, maturity, and market size, but do not provide the elements needed here to analyse a Saudi service during a compound shock. The absence of data in this study should not be interpreted as proof that institutions do not possess it. Original and professional sources describe the cloud-facility incident, but we do not have the customer records needed to infer the frequency or distribution of loss, or its effect on Saudi functions.
Incident-source limits: Service-provider statements are primary sources for what those providers disclosed, while some conclusions may still require independent scrutiny. A report that another institution experienced a simultaneous outage is not, by itself, proof that the fault propagated to it. The regulator's Optus findings do not turn failed connections into unproven claims about individual health outcomes. The NHS evidence concerns specific services in a specific location.
Experimental limits: The categories, weights, probabilities, outage durations, architectures, and amount of degraded-mode capacity are synthetic. No financial resources or legal considerations are actually implemented. There is no congestion model, no demand shifting between services, no social distribution of harm, and no institutional learning after each event. The assumption of one outage window for each component within 48 hours may not fit prolonged crises or repeated attacks. “Failure sharing” is an experimental probability mixture, not an estimate of a universal correlation among suppliers.
Performance-indicator limits: A count of healthy operating hours is not automatically a measure of continuity of rights. Demand coverage itself is insufficient without a valid reference demand, the effects of delay, and the distribution of access. Comparisons across unlike services become misleading if the definition of “valid completion” or the handling of work that never reached the portal changes.
Literature limits: The review is selective and mechanism-focused. The two network papers differ in their assumptions; what appears to be a contradiction in results is information about the conditions under which a system operates. We did not conduct a comprehensive search of all published papers or a systematic review classified under systematic-review reporting rules.
What was verified in practice: The simulation program was run and produced readable values, assumptions, and figures. We checked the consistency of service weights and basic synthetic capacity bounds. This is limited computational verification. It does not establish that the model is valid for an external reality or that the future will resemble its samples.
11. Proposed Programme for a Subsequent Study
The paper could develop into independent empirical work through four connected steps, provided that access and definitions are agreed before results are examined:
Step one: a service-definition protocol. Identify a measurable set of essential functions with different timing requirements, and define valid completion and acceptable delay. Establish a route for protecting privacy and concealing the structure of individual facilities. Before confirmatory analysis, the protocol should state rules for excluding insufficient data and handling missing values.
Step two: an aggregate dependency map and tested alternatives. Researchers distinguish shared supplier, software, region, identity, and repair mechanism. Operational maps revealing critical facilities are not published; sector tables or anonymised or synthetic data are used where necessary. Time to switch to an alternative and the quality of completion are measured instead of counting alternatives listed in a procurement document.
Step three: a comparison with falsifiable hypotheses. Authorised exercises include failure of one component, failure of several independent components, and a hypothetical event affecting a shared dependency, with an agreed progression in severity. Researchers identify the functions most sensitive to time and track demand that was lost, delayed, or completed through an alternative. Rules for counting backlog and recovery should be recorded in advance.
Step four: economic analysis and independent replication. Lifecycle cost is calculated, and redundancy and dependency-reduction options are compared with actual service continuity. Another service set or later exercises test transferability. Quantitative future forecasts should be constructed only after a sequence of results permits out-of-sample comparison and measurement of forecast calibration, not from a single experiment.
If the study finds that integration increases demand coverage in ordinary conditions and during shocks, that would be a strategically valuable result and should be published. If it finds that a particular shared dependency creates a broad shortfall, the explanation should be published within its proper limits while protecting infrastructure security. Proposed alternatives should undergo independent testing so that a shocking story does not become a ready-made argument for buying equipment whose value is unknown.
12. Reproducible Outputs and Data Availability
The completed assets in this package are:
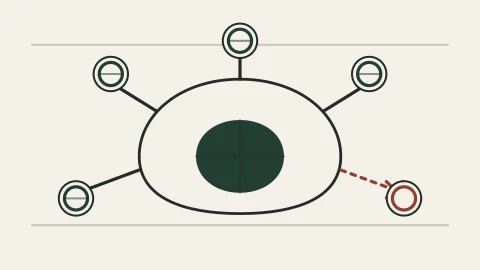
analysis/reproduce.py: complete source for generating synthetic events, calculating measures, and producing figures.data/assumptions.json: scenario variables, weights, constraints, seeds, and interpretation limits.data/simulation_results.csv: 27 result rows across nine assumption sets and three architecture options.figures/figure_01_dependency_map.svgand.png: a visualisation of abstract relationships; it does not represent a specified facility.figures/figure_02_coverage_sensitivity.svgand.png: grouped means and simulation error for a set of conditions.analysis/requirements.txt: libraries needed to run the example.
The data files contain no Saudi records, user data, or facility maps. The only source of the simulation values is the disclosed synthetic scenario generator. They can be reproduced by running the program according to analysis/README.md. The real-world sources are public references whose dated versions should be revisited whenever they are reused, with any later correction recorded.
13. Scientific Conclusion and Open Question
The published evidence gives a strong reason to examine shared dependencies in the digital state, while competing theoretical evidence shows that integration can lead to greater robustness when it creates independent alternatives. Documented incidents indicate that services, data, and backlogs may follow different recovery timelines. Within its own boundaries, our executed simulation showed only that the comparison changes when an independent alternative becomes one that shares the same failure cause, and that valid degraded continuity may recover some demand without addressing every failure.
Testable practical conclusion: If a digital state wants to know how far it has advanced under pressure, it should measure, at an aggregate level, the amount of essential demand that continues to be served safely, the speed of return to a known threshold, and the price of the options that make this possible, while disclosing what current numbers cannot prove. The open question for subsequent research remains: Which form of operational independence gives the best protection for each type of service, within the constraints of cost, rights, location, and resources?
References and Attribution Rules
These sources are dated by their publishers, and their links are the reference points for reviewing claims. The content of some dynamic government pages could be verified through search indexing or linked official releases; this is recorded in source_register.csv. Evidence that a report was issued must not be confused with evidence for every possible interpretation of its figures.
- S01 Communications, Space and Technology Commission (CST), Saudi Internet 2025, 2026. https://www.cst.gov.sa/en/knowledge-center/reports/saudi-internet-25
- S02 Digital Government Authority (DGA), The Digital Experience Maturity Index for 2025 Rises to 86.71%, August 2025. https://dga.gov.sa/en/news/rise-in-the-digital-experience-maturity-Index-2025
- S03 National Cybersecurity Authority (NCA), Key Economic Indicators in the Cybersecurity Sector 2026, 14 October 2026, figures for 2025. https://nca.gov.sa/en/news/report-on-key-economic-indicators-in-the-cybersecurity-sector-in-the-kingdom-2026/
- S04 Amazon Web Services, AWS Health Dashboard: Service Health and Historical Incident Updates, March–October 2026; consult event history as revised. https://health.aws.amazon.com/health/status
- S05 Reuters, Amazon cloud unit's data centers in UAE, Bahrain damaged in drone strikes, published 2 March 2026, updated 3 March 2026. https://www.reuters.com/world/middle-east/amazon-cloud-unit-flags-issues-bahrain-uae-data-centers-amid-iran-strikes-2026-03-02/
- S06 Amazon Staff, AWS Bahrain Region disrupted by ongoing conflict, 24 March 2026. https://www.aboutamazon.com/news/aws-bahrain-region-middle-east-conflict
- S07 Reuters, Amazon's AWS is unable to restore access to Bahrain, one UAE cloud data zone after war damage, 15 September 2026. https://www.reuters.com/world/middle-east/amazons-aws-is-unable-restore-access-bahrain-one-uae-cloud-data-zone-after-war-2026-09-15/
- S08 CrowdStrike, To Our Customers and Partners, 19 July 2024. https://www.crowdstrike.com/en-us/blog/to-our-customers-and-partners/
- S09 NHS Shropshire, Telford and Wrekin, Update on IT outage – EMIS up and running but some delays expected, 22 July 2024. https://www.shropshiretelfordandwrekin.nhs.uk/news/update-on-it-outage-emis-up-and-running-but-some-delays-expected/
- S10 Australian Communications and Media Authority (ACMA), Optus pays $12 million penalty for Triple Zero outage, 8 November 2024, referring to the 8 November 2023 outage. https://www.acma.gov.au/articles/2024-11/optus-pays-12-million-penalty-triple-zero-outage
- S11 Buldyrev, S. V., Parshani, R., Paul, G., Stanley, H. E., and Havlin, S., Catastrophic Cascade of Failures in Interdependent Networks, Nature 464 (2010), 1025–1028. DOI: 10.1038/nature08932. https://www.nature.com/articles/nature08932
- S12 Radicchi, F., and Bianconi, G., Redundant Interdependencies Boost the Robustness of Multiplex Networks, Physical Review X 7 (2017), 011013. DOI: 10.1103/PhysRevX.7.011013. https://journals.aps.org/prx/abstract/10.1103/PhysRevX.7.011013
- S13 National Institute of Standards and Technology (NIST), Developing Cyber-Resilient Systems: A Systems Security Engineering Approach, SP 800-160 Vol. 2 Rev. 1, December 2021. DOI: 10.6028/NIST.SP.800-160v2r1. https://csrc.nist.gov/pubs/sp/800/160/v2/r1/final
- S14 Perrow, C., Normal Accidents: Living with High-Risk Technologies, updated edition, Princeton University Press, 1999. https://www.jstor.org/stable/j.ctt7srgf
- S15 Simon, H. A., The Architecture of Complexity, Proceedings of the American Philosophical Society, 106 (1962), 467–482; bibliographic and scholarly discussion at Santa Fe Institute Press. https://www.sfipress.org/21-simon-1962
- S16 Reuters, Iran has detailed plans to hit Gulf undersea cables if war resumes, officials say, 23 October 2026; statements are conditional and unverified as future actions. https://www.reuters.com/world/middle-east/iran-has-detailed-plans-hit-gulf-undersea-cables-if-war-resumes-officials-say-2026-10-23/