Original strategic essay. Events are bounded by their sources; the simulation is synthetic and does not measure Saudi services. Information cutoff: 25 October 2026.
Keywords digital prosperity paradox · service continuity · cloud infrastructure · common-cause failure · cyber resilience · Saudi Arabia · Gulf · synthetic simulation
In this article
The Strike That Revealed the Cloud's Physical Ground: The Digital Prosperity Paradox in the Gulf and Saudi Arabia
The Digital Prosperity Paradox: Cloud Infrastructure, Common-Cause Failure, and Saudi Service Continuity
MERIDIAN | First Strategic Essay M01 | 25 October 2026 | Analytical Horizon: 2026–2035
Opening: When American cloud facilities in the Gulf were damaged during the war, the event revealed less about a weakness in technology than about a question overlooked by some measures of technological success: what remains of a service, and of its records, when the places on which they jointly depend are hit? This essay examines how a digital state can combine efficiency with continuity, what we actually know about Saudi Arabia, and what must be tested before anyone declares either confidence or alarm.
Editorial note: The factual events are tied to named sources and dates. Conclusions about the resilience of Saudi systems are conditional hypotheses and inferences. The accompanying figures and simulation use disclosed synthetic values and do not describe any particular Saudi facility or service.
1. The Day the Cloud Found Ground Beneath It
Technical language has taught us to look upward whenever we speak of “the cloud.” We imagine something distributed, available from anywhere, and acquainted with geography only through a menu from which we select the location nearest the user. In March 2026, that idea had to come rapidly back to earth.
On 2 March, Reuters reported an update from Amazon Web Services (AWS): two company facilities in the United Arab Emirates had sustained direct strikes, while a drone strike near a facility in Bahrain caused physical damage to infrastructure. The company described damage to buildings, power disruption, and the effects of firefighting operations on some equipment. The disruption extended to several cloud services, and the company expected recovery to take considerable time because of the nature of the damage. The report placed the events in the context of Iranian attacks on Gulf states during the war. S05
This paragraph contains no secret technical location or target map, and it needs neither. The general fact is enough: a service that appears placeless depends on physical places, physical power, physical access routes, and people able to repair what has been damaged. Data may travel at nearly the speed of light. Replacing destroyed equipment, securing safe access to facilities, and reconstituting a complex system operate on a very different clock.
Then came the information that changed the character of the story. On 15 September 2026, the company said, in an update reported by Reuters, that it could no longer restore access to resources and data hosted exclusively in the damaged Bahrain cloud region and in one damaged Availability Zone in the United Arab Emirates. It said the damage in Bahrain spanned multiple Availability Zones and exceeded what its regional and multi-zone services were designed to withstand. The company continued to help customers operate from other regions. S07
The word “exclusively” deserves attention. Anything whose access was lost under that condition was bound to a geographic and technical limit that the available recovery mechanisms could not cross. Many customers with valid copies or portable resources, meanwhile, were able to resume operations elsewhere, according to Amazon. S06S07 The incident therefore carried two different kinds of evidence at once: failure at some limits of tolerance, and varying degrees of success in migration and continuity paths.
Before writing that “the digital region collapsed,” we should specify which region, which resources, which services, and which period. Before writing that “all the data was lost,” we should read “exclusively” a second time. Precision here is not bureaucratic work that spoils the drama. It is what prevents the drama from spoiling the truth.
2. The Paradox Created by Success Itself
The question lies in the philosophy of design. A shared network becomes more attractive as it grows faster, cheaper, and easier to maintain. Instead of every institution building a separate system for identity, payments, hosting, or operational monitoring, each can draw on a specialised common capability. Its value may grow with use: expertise accumulates in one place, and a single fix can benefit many users. These are real potential gains, not decoration for an investment presentation.
Yet the connection that carries the benefit may also carry the damage. If five services share one critical dependency, an incident becomes a question about five services, even if each has an excellent interface, a security certificate, and a strong performance history. Researchers call this possibility common-cause failure. They call the movement of damage through mutually dependent layers cascading failure.
This does not make all centralisation a mistake or all distribution a route to survival. A distributed system may reproduce the same software flaw at several locations, multiply coordination costs, and make conflicting data harder to reconcile. Centralisation, in turn, may offer professional management, standardised procedures, earlier fault detection, and reserve capabilities that each small institution would struggle to build on its own. What matters is not the number of nodes in the diagram, but the independence of their failure causes, the presence of valid alternatives, and people's ability to continue their work safely.
The hypothesis can be stated plainly. Integrated digitisation may improve average service quality under ordinary conditions, yet increase losses from some shocks when many functions depend on systems that fail together. The reverse may happen if integration produces better reserve capacity, clearer operational information, and faster recovery. This is why we call the subject the Digital Prosperity Paradox: a hypothesis about the conditions and multipliers of success, not a ready-made indictment.
3. Three Saudi Numbers, and Three Different Questions
This issue matters to Saudi Arabia because the scale of its technology use gives the question economic and social weight. Measurement, however, begins by respecting what each number means, not by piling numbers around a conclusion we already prefer.
| Indicator | Value and period described | Institution and proper limit of inference |
|---|---|---|
| Internet penetration | 99.6%, according to the Saudi Internet 2025 report published in 2026 | Communications, Space and Technology Commission (CST). This is a measure of penetration under the report's definition; it does not measure the continuity of every digital service during a crisis. S01 |
| Digital Experience Maturity Index | 86.71% in the 2025 cycle, after the assessment of 50 government platforms | Digital Government Authority (DGA). The index includes aspects of beneficiary experience and other dimensions; it is not the probability that a transaction will be restored after a shared shock. S02 |
| Cybersecurity market size | SAR 16.3 billion in 2025, according to a report published on 14 October 2026 | National Cybersecurity Authority (NCA). This is the size of a products-and-services market; it is neither a figure for outage costs nor a performance indicator from a recovery test. S03 |
These are useful indicators within their proper domains. Penetration tells us that access is extensive under the measure's definition. Experience maturity tells us something about the quality of the service channels included in the assessment. Cybersecurity market size describes economic and investment activity. None directly measures how many essential requests were completed within an acceptable time after a simultaneous disruption, how many were delayed, or how long recovery took.
All three high values may coexist with high resilience; they may also coexist with a dependency the indicator never tested. The table alone supports neither conclusion. What we know is that a country with extensive technology use deserves to have the function of that technology measured when its operating conditions change. What we lack for that judgement is time-bounded service data, recovery exercises, and authorised aggregate measurement of dependencies.
There is a quiet irony in the language of digital administration. A single report can describe page speed, user satisfaction with buttons, and the number of institutions on the platform, while leaving recovery after an outage unanswered because no one placed it in the evaluation table. That is no flaw if the report was designed to measure experience. The error lies in asking it to prove a capability it was never designed to measure.
4. When the System Returns but People's Lives Remain in Its Queue
We should distinguish the wartime incident from the general mechanism it tests. In July 2024, a faulty update to a CrowdStrike component on Windows devices caused widespread technical disruption. The company acknowledged the fault and said the incident was not a cyberattack. S08
On 22 July, a local organisation within the United Kingdom's National Health Service (NHS) announced that the EMIS records and appointments system was back for the services it identified, but work accumulated during the outage continued to delay the processing of prescription requests and the entry of paper records. S09
This small institutional account teaches something larger than its scale: restoring software does not erase the work that waited for it. If a team had fifty requests on schedule before the outage, then returned to a backlog of one hundred, the screen might be green while users' lives have not returned to their normal course. The figures here are illustrative, not data from that organisation.
There is a more dangerous limit to this gap between connection and function. In Australia, the Australian Communications and Media Authority (ACMA) found that the Optus network outage on 8 November 2023 prevented 2,145 users from accessing the emergency call service, according to the regulator's statement, and recorded a failure to conduct 369 required welfare checks after unsuccessful call attempts. This is a specific regulatory count for the incident, not a count of casualties or medical outcomes. S10
We now have three distinct kinds of fact: cloud resources, some of which could no longer be recovered; a health system that returned before its backlog had cleared; and a telecommunications network that failed to deliver a request whose value depended on time. The examples do not belong to one institution or country and cannot prove that an equivalent event occurred in Saudi Arabia. They do show why success should be defined from the essential service outward, including safety, timing, and backlog all the way to the user.
5. What Did the Mathematics Say—and What Did It Not Say?
In a 2010 study in Nature, Sergey Buldyrev and colleagues built models of interdependent networks. Their models showed that, under certain conditions, removing a limited number of elements from one network may weaken another network that depends on it, with damage then cascading back to the first. The behaviour may differ greatly from tests of each network's strength in isolation. S11
The idea sounds obvious until we confront its implication. An electricity layer may survive some faults, and a communications layer may do the same, yet that does not ensure that the combined system will survive when control communications depend on power and some power operations depend on communications. The strength of each component cannot simply be added together to produce the strength of the whole.
Science itself, however, warns against the claim that “more interconnection always means more fragility.” In a 2017 study in Physical Review X, Filippo Radicchi and Ginestra Bianconi showed, within a different model of multiplex networks, that redundant interdependencies can increase robustness. The distinction is decisive: a node may need every path to operate together, or it may need only one of several valid, independent paths. S12
Imagine a door that requires three keys at the same moment. More keys mean more conditions that may block entry. Now imagine a door that accepts any one of three keys kept independently. Here, more keys mean more options. Both doors have “three keys,” but dependency means something different in each case. The example illustrates the model's logic; it does not turn a door into real infrastructure.
Systems thinking drew a related lesson from an older intellectual history. In Normal Accidents, Charles Perrow distinguishes between complex interactions and tight coupling, explaining why some failures in high-risk systems are difficult to foresee. S14 In The Architecture of Complexity, published by Herbert A. Simon in 1962, near-decomposability becomes important: parts whose behaviour can, to a meaningful degree, be understood and managed without every movement depending on a movement of the whole system. S15
This is not a recipe for building five separate digital states within one country. The point is more precise: a service interface and its standards may be unified while selected failure paths and continuity capabilities are deliberately separated. Sharing knowledge is an advantage. Sharing a single point of failure is a different engineering decision.
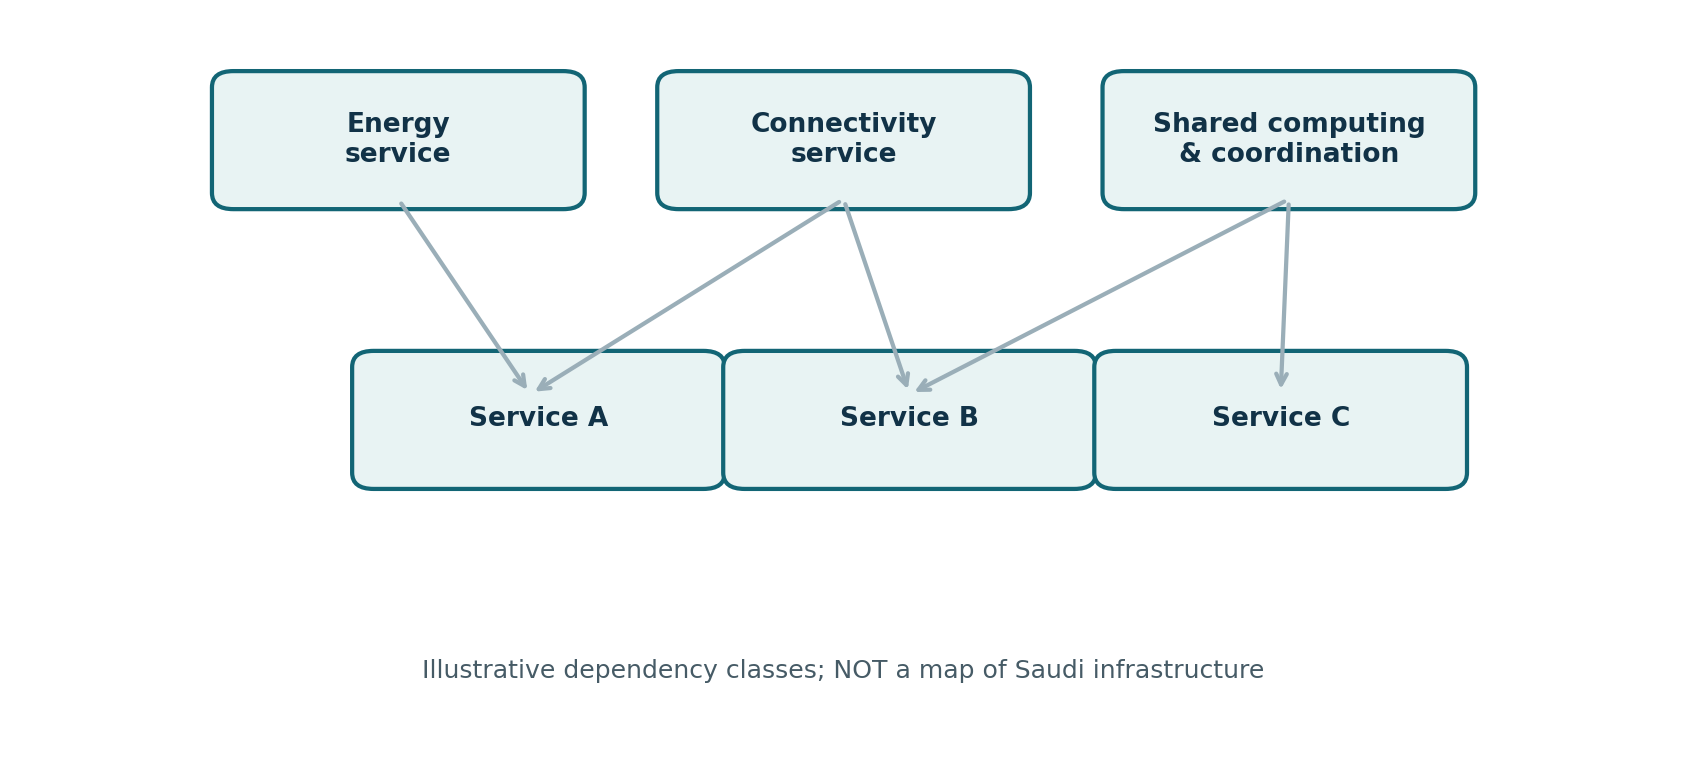
Figure 1 — A conceptual map of technical and service dependency classes. The arrows are hypothetical and explanatory only; the diagram does not represent an actual facility network or real vulnerabilities in Saudi Arabia or the Gulf region.
6. A Small Laboratory That Does Not Know Where Saudi Arabia Is
To keep the paradox from floating free of any test, we ran a reproducible synthetic simulation. Imagine five abstract service categories with constant demand over a hypothetical 48-hour window. The model contains three architectures: one shared computing path; two paths assumed to be independent; and two paths plus a fallback mode able to perform a limited share of some functions in a way assumed to be valid and safe during an outage.
We ran 40,000 computational trials for each set of assumptions, using documented random generation and identical handling of shocks when comparing architectures within the same set. The probability of an event affecting an independent component, the probability of a common shock, outage durations, service weights, and the share of fallback capacity are all numbers we invented to examine the mathematical logic. We did not derive them from Saudi services, attack records, or customer data. We also assumed that the independent dual-path design incurs a small operational cost, represented by reducing nominal capacity under normal conditions to 98.5%. This, too, is an adjustable assumption.
The model tests a question often concealed by the word “backup”: does the alternative fail with the original? In a scenario where the backup path fails independently, it can carry demand when the first path goes down. If both paths share the same event and outage period, calling them “two paths” does not give them two independent reasons to survive.
| Assumed probability of a common shock within 48 hours | Sharing of path-failure events | One shared path | Two paths | Two paths with limited continuity |
|---|---|---|---|---|
| 0% | Independent in the model | 92.93% | 97.24% | 97.31% |
| 20% | Independent in the model | 88.40% | 92.44% | 93.31% |
| 20% | Share the assumed failure event | 88.37% | 87.04% | 88.81% |
| 50% | Independent in the model | 81.40% | 85.04% | 87.14% |
Table 2 — Mean share of synthetic demand completed within 48 hours, from an actual run of the model. “Sharing of failure events” is not a correlation coefficient estimated from operations; it is an experimental-design assumption. Small differences in decimal percentage points across repetitions of the same scenario include simulation error, not an estimated difference in national performance.
In the second row, the alternative path added about 4.04 percentage points of coverage compared with the single path, and limited continuity raised the result to 93.31%. In the third row, when we assumed that both paths shared their failure event, the two-path design alone performed worse on average than the single path. We retained its assumed capacity cost while removing the benefit of independence. Partial continuity restored some value, but did not solve the whole problem.
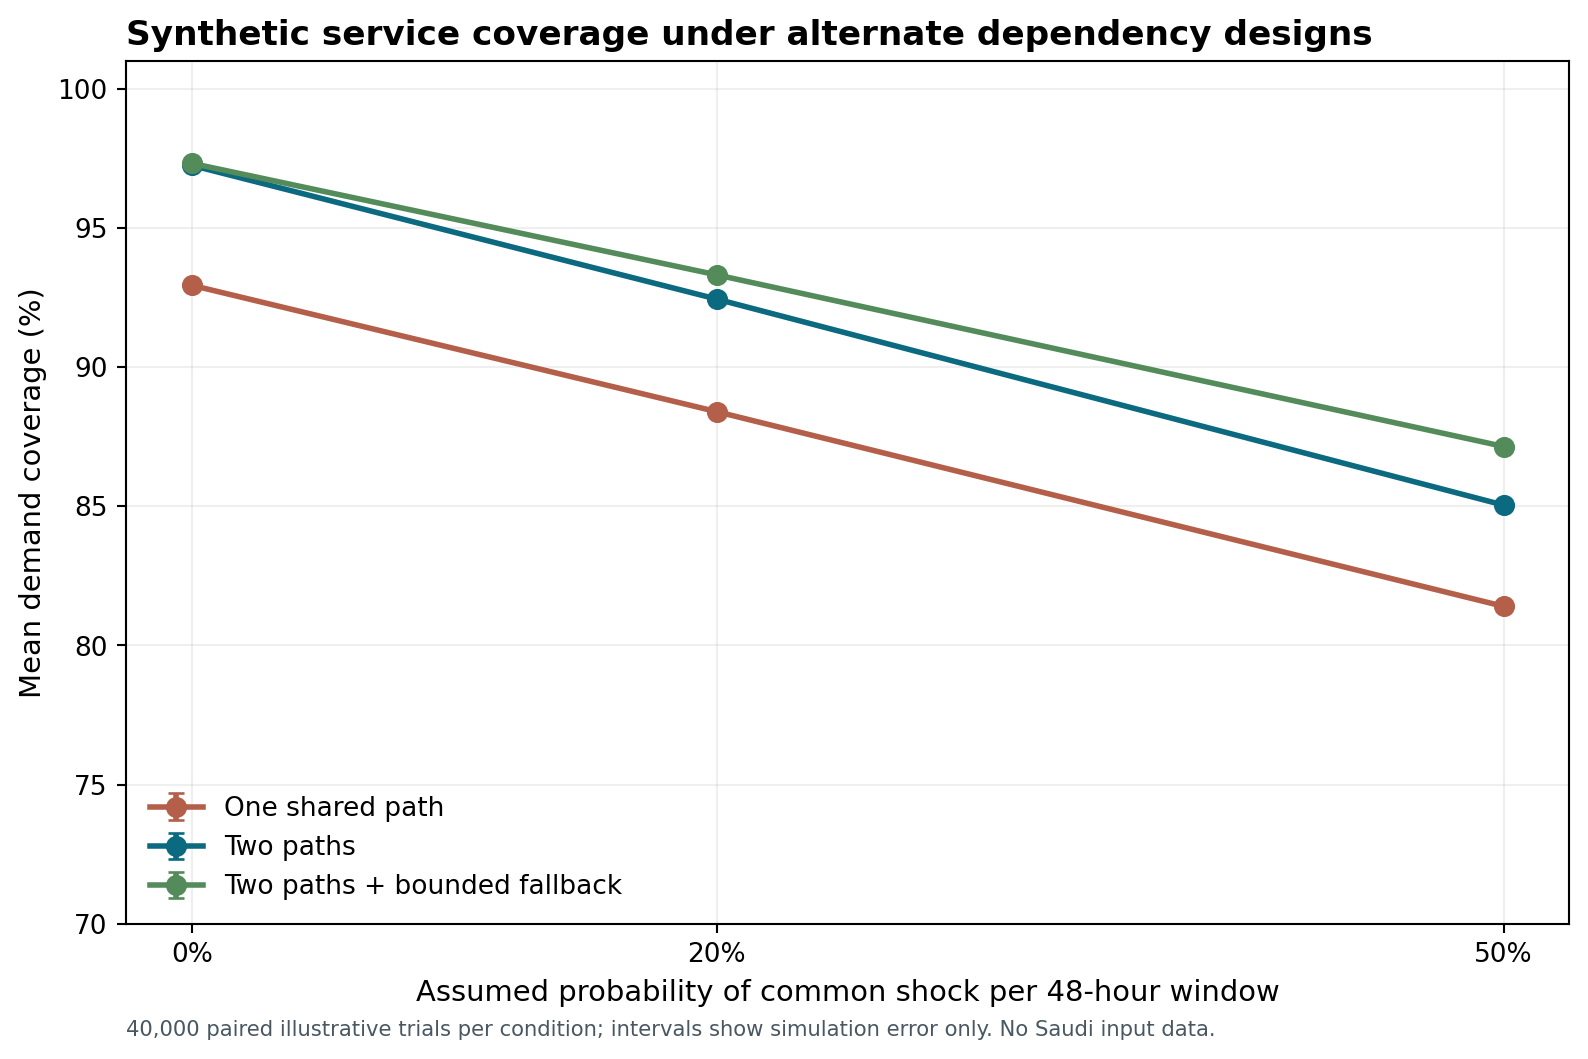
Figure 2 — A synthetic experiment comparing three architectures while assuming independent failure of the backup path, across three common-shock probabilities. The small bars show Monte Carlo error arising from the number of trials, not an uncertainty range for Saudi performance. Code and detailed data appear in the scientific companion.
What scientific value can an experiment have if it contains no Saudi data? It reveals the conditions under which the result changes. We saw the ordering of the options reverse when the failure-sharing assumption changed, even though the technology's name and the number of servers did not. But the simulation does not show that these probabilities are realistic, that the five services resemble the actual distribution of services, or that degraded operation is legally or safely possible for any particular service. Nor does it calculate backlog, lost records, financial cost, or supplier delay. Those are questions for later research, not details to bury in a footnote.
7. Four Names for the Same Word, “Return”
After a technical incident, reassuring statements often say that “systems are back.” The phrase may compress four stages that differ in both time and meaning:
- Component availability: A server, connection, or program is operating again.
- Functional continuity: The real request can again be completed with acceptable quality and safety.
- Backlog clearance: Requests or reviews delayed during the outage have been completed.
- Recoverability: Data, backup capabilities, support, and suppliers are ready for a subsequent failure.
The earlier incidents separated these meanings. A health organisation said a program was back, while the work still needed time to catch up. S09 Amazon said that customers had moved to other regions while resources held exclusively in damaged locations remained inaccessible. S06S07 For a user, opening a page is different from completing a transaction; completing it today is different from losing rights recorded in data that cannot be recovered tomorrow.
We can express the issue through a proposed research measure, Valid Demand Coverage:
The numerator is the amount of service delivered under the required conditions of quality, safety, and timing, capped at the justified reference demand. The denominator is the total reference demand over the period. The weights are disclosed value assumptions whose sensitivity must be tested. Quantities must be non-negative, and the denominator for each included service must be greater than zero. This is a proposal that requires validation; it is neither an official government indicator nor a measure of national resilience.
We need not combine electricity, payments, and an information service into one number before understanding each separately. Readers should see a dashboard for each function showing what was completed, what was not, the most severe period of degradation, time to an acceptable threshold, backlog, and the cost of continuity. A national average may conceal a severe delay in one place or among a group that depends on a critical service.
One of measurement's most dangerous tricks is a fall in recorded demand during a crisis. When people cannot reach the portal, the number of requests may appear low; the completion rate may even rise among requests that arrived at all. The denominator therefore needs a justified estimate of the demand that should have been served, together with sensitivity analysis for that assumption. A queue disappearing from the screen is not proof that the queue has ended.
8. The Economics of the Paradox: What Does the Path We Hope Never to Need Cost?
Clear budgets like to show annual savings: a shared centre with less duplicated equipment, a larger procurement contract, one specialised team, uniform maintenance. That may be economically sound. Yet continuity under a compound shock requires comparison of lifecycle cost, including recovery exercises, some duplication of resources, update burdens, data transfer, location and regulatory requirements, acceptable delay, and investment that brings no return in ordinary conditions but purchases an option in a crisis.
For a heavily used service with little tolerance for delay, the best alternative may be a small reserve capacity tested regularly. For a non-urgent service, scheduled deferral and honest communication with the user may be better than duplicating the entire architecture. Some data may be subject to residency or protection requirements that make copying it to another country a legal and operational issue requiring advance design. A second server does not create independence if it depends on the same software identity, the same access key, or the same supplier who will be unreachable during a crisis.
The investment question is therefore not only “How many data centres do we have?” It is also: Which function benefits from greater capacity? Does it close the recovery-time gap? Do copies remain usable and verifiable when identity, power, or communications services fail? And what does that independence cost?
There is a wide gap between announcing a plan and proving the economic value of an option. We may announce billions in infrastructure or cite an enormous number of processing units. Those are capital or equipment quantities. Useful service is the product of capacity actually used, demand that will pay for or needs it, and a performance level that persists when costs rise or the environment changes. This series will return to the issue in greater depth in its twelfth essay, on the GPU Capital Trap.
9. How Can We Test the Saudi Question Honestly?
If a published indicator map showed today that access is broad, experience is advanced, and technology spending is growing, the next scientific step would be to request service-continuity measurements at an authorised aggregate level. Such measures should explain the effect of shared dependencies without disclosing sensitive maps of particular facilities.
Testing begins by grouping services with similar time sensitivity and beneficiary rights. We take a permitted institutional sample and define the function expected to continue; write defensive outage scenarios; measure the valid share completed, the duration of degraded performance, recovery, and backlog; then compare more integrated with less integrated systems while controlling for influential differences: budget, institutional competence, service complexity, demand, supplier quality, and results of earlier recovery exercises.
The coincidence of building a central platform with improved service does not establish centralisation as the cause. Management may be better, maintenance more complete, or funding higher. Nor does an attack on a cloud facility in a neighbouring country establish that a Saudi system will suffer the same outcome. Estimating a causal effect requires defining the comparison and the sources of variation that may confound it, perhaps through designed recovery exercises or quasi-experimental designs when events and data permit.
The test could become a programme with four practical tracks:
| Research track | Measurement question | Useful evidence | What requires caution |
|---|---|---|---|
| Functional continuity | How much essential demand was served safely during degradation? | Aggregate institutional records from authorised exercises | Treating “the server is online” as sufficient, or dropping demand that never arrived. |
| Common dependency | What share of functions is affected by one event? | Classified, anonymised descriptions of supplier and dependency categories | Publishing sensitive operational locations or connections. |
| Alternative paths | What remained functional when the primary path failed? | Migration and recovery tests, including failed test outcomes | Counting backups without testing their use. |
| Economics of continuity | Is alternative capacity worth its cost? | Total costs, demand scenarios, and specified delay losses | Equating announced spending with service actually delivered. |
The comparison may produce a result different from what we expect. Institutional integration, through better management, measurement, and multiple suppliers, may be a cause of better continuity. Or one category may reveal that all its paths end at a single dependency that needs correction. Good research permits both possibilities to appear and makes the decision follow the result.
10. Toward 2035: What Should We Watch?
This essay assigns no numerical probabilities to the fate of the digital state over the next decade. It can still set out conditional paths that would change decisions today:
Path one — integration that strengthens continuity. Many services improve because shared management enables monitoring, remediation, and an orderly transition to alternatives. The signal that matters is that documented tests show shorter functional recovery time and smaller backlogs, while cost remains acceptable.
Path two — attractive savings and difficult dependence. Everyday services accelerate, but contracts, data, or coordination tools concentrate in paths exposed to the same shock. The signal is not the attack itself, but the failure of declared alternatives when called upon, or a rise in the cost of switching suppliers.
Path three — a gradual move toward exportable resilience. Products emerge for recovery management, testing, dependency analysis, and safe operation with reduced connectivity. Buyers make repeat purchases based on actual performance. The signal is recurring product revenue and documented results across different customers, not an abundance of presentations.
In October 2026, Reuters reported statements by Iranian officials about possible plans and threats against subsea cables if fighting resumed. This was a report about alleged plans and threats, not a report that a new attack on those cables had occurred. The report also noted the potential to reroute traffic and the limits of the global effect compared with the possible regional effect. S16 Here the value of a scenario becomes clear: alternatives can be tested in theory and prepared without claiming to know what will happen.
11. What Did the Strike Change About the Question?
The story of strikes on Gulf cloud infrastructure does not end with damaged metal or an unavailable node. Some customers succeeded in moving their operations. Access to some data remained impossible because it had stayed in specific locations. Design limits proved narrower than the shock they faced. S06S07 The striking point is that the great differences among outcomes arose from things an application user cannot see: where a copy resides, whether its independence is real, how the alternative is activated, and how long it takes to decide to switch.
A digital state can advance in two good directions at once: make ordinary life easier and build the capacity to serve people when life becomes difficult. The second requires its own measurement. A fast portal on a quiet morning is not enough. The system should know what it may do when one of its conditions is absent, when it must stop to preserve the integrity of a decision, how it explains the event to the user, and where it retains what is needed to fulfil that person's right later.
Under this reading, the series' opening question becomes more exact: if five excellent services rest on one foundation, do we have five services capable of continuity, or five beautiful windows onto a foundation whose absence we have never tested?
The answer comes neither from the headline of an attack, nor the scale of spending, nor our synthetic model. It comes from testing: how much service remains, whether it remains valid, how quickly it recovers, and the price that makes continuity possible. Placing these questions at the heart of digital prosperity does not diminish that prosperity. It tells us which part of the achievement can cross a day that was not designed to fit ordinary conditions.
Reading and Evidence Notes
- Principal incident: Physical damage affected a regional cloud provider's infrastructure in March 2026, followed by a constrained recovery finding in September of the same year. Evidence includes company statements and Reuters' original reporting. S05S06S07
- National boundary: We found no public data in the reviewed sources sufficient to measure the effect of those strikes on the continuity of specific Saudi government functions. Any generalisation from this incident alone about Saudi weakness or strength is excluded.
- Scientific comparison: The two network papers S11S12 study models with different assumptions. Neither replaces verification of local dependencies and data.
- Computational experiment: The values in Table 2 and Figure 2 are synthetic outputs produced by actually running the accompanying code. They must not be placed in a series of real statistics or interpreted as an incident forecast.
- Research companion:
research_companion_en.mdpresents the method, assumptions, results, reading of the literature, and a proposed test using authorised information.
Principal Sources
- S01 Communications, Space and Technology Commission (CST), Saudi Internet 2025, 2025 data published in 2026. https://www.cst.gov.sa/en/knowledge-center/reports/saudi-internet-25
- S02 Digital Government Authority (DGA), Digital Experience Maturity Index for 2025, 2025 results covering 50 platforms. https://dga.gov.sa/en/news/rise-in-the-digital-experience-maturity-Index-2025
- S03 National Cybersecurity Authority (NCA), 14 October 2026 statement on 2025 sector indicators. https://nca.gov.sa/en/news/report-on-key-economic-indicators-in-the-cybersecurity-sector-in-the-kingdom-2026/
- S05 Reuters, 2–3 March 2026, company statement on physical damage to cloud infrastructure. https://www.reuters.com/world/middle-east/amazon-cloud-unit-flags-issues-bahrain-uae-data-centers-amid-iran-strikes-2026-03-02/
- S06 Amazon, statement on the continued migration of customers from the Bahrain Region. https://www.aboutamazon.com/news/aws-bahrain-region-middle-east-conflict
- S07 Reuters, 15 September 2026, company update on resources hosted exclusively in damaged locations that could not be restored. https://www.reuters.com/world/middle-east/amazons-aws-is-unable-restore-access-bahrain-one-uae-cloud-data-zone-after-war-2026-09-15/
- S08 CrowdStrike, 19 July 2024 statement on the faulty update. https://www.crowdstrike.com/en-us/blog/to-our-customers-and-partners/
- S09 NHS Shropshire, Telford and Wrekin, 22 July 2024 update on the backlog after the system returned. https://www.shropshiretelfordandwrekin.nhs.uk/news/update-on-it-outage-emis-up-and-running-but-some-delays-expected/
- S10 Australian Communications and Media Authority (ACMA), findings from its review of the Optus outage, November 2024. https://www.acma.gov.au/articles/2024-11/optus-pays-12-million-penalty-triple-zero-outage
- S11 Buldyrev et al., Catastrophic Cascade of Failures in Interdependent Networks, Nature, 2010. DOI: 10.1038/nature08932. https://www.nature.com/articles/nature08932
- S12 Radicchi and Bianconi, Redundant Interdependencies Boost the Robustness of Multiplex Networks, Physical Review X, 2017. DOI: 10.1103/PhysRevX.7.011013. https://journals.aps.org/prx/abstract/10.1103/PhysRevX.7.011013
- S13 National Institute of Standards and Technology (NIST), Developing Cyber-Resilient Systems, SP 800-160 Vol. 2 Rev. 1, December 2021. https://csrc.nist.gov/pubs/sp/800/160/v2/r1/final
- S14 Charles Perrow, Normal Accidents: Living with High-Risk Technologies, updated edition, Princeton University Press, 1999. https://www.jstor.org/stable/j.ctt7srgf
- S15 Herbert A. Simon, The Architecture of Complexity, Proceedings of the American Philosophical Society, 1962, 106: 467–482. Bibliographic discussion from Santa Fe Institute Press: https://www.sfipress.org/21-simon-1962
- S16 Reuters, 23 October 2026, conditional statements concerning risks to subsea communications cables. https://www.reuters.com/world/middle-east/iran-has-detailed-plans-hit-gulf-undersea-cables-if-war-resumes-officials-say-2026-10-23/